Ravi Sir's Cards › Chapter 13: Monitoring Basics
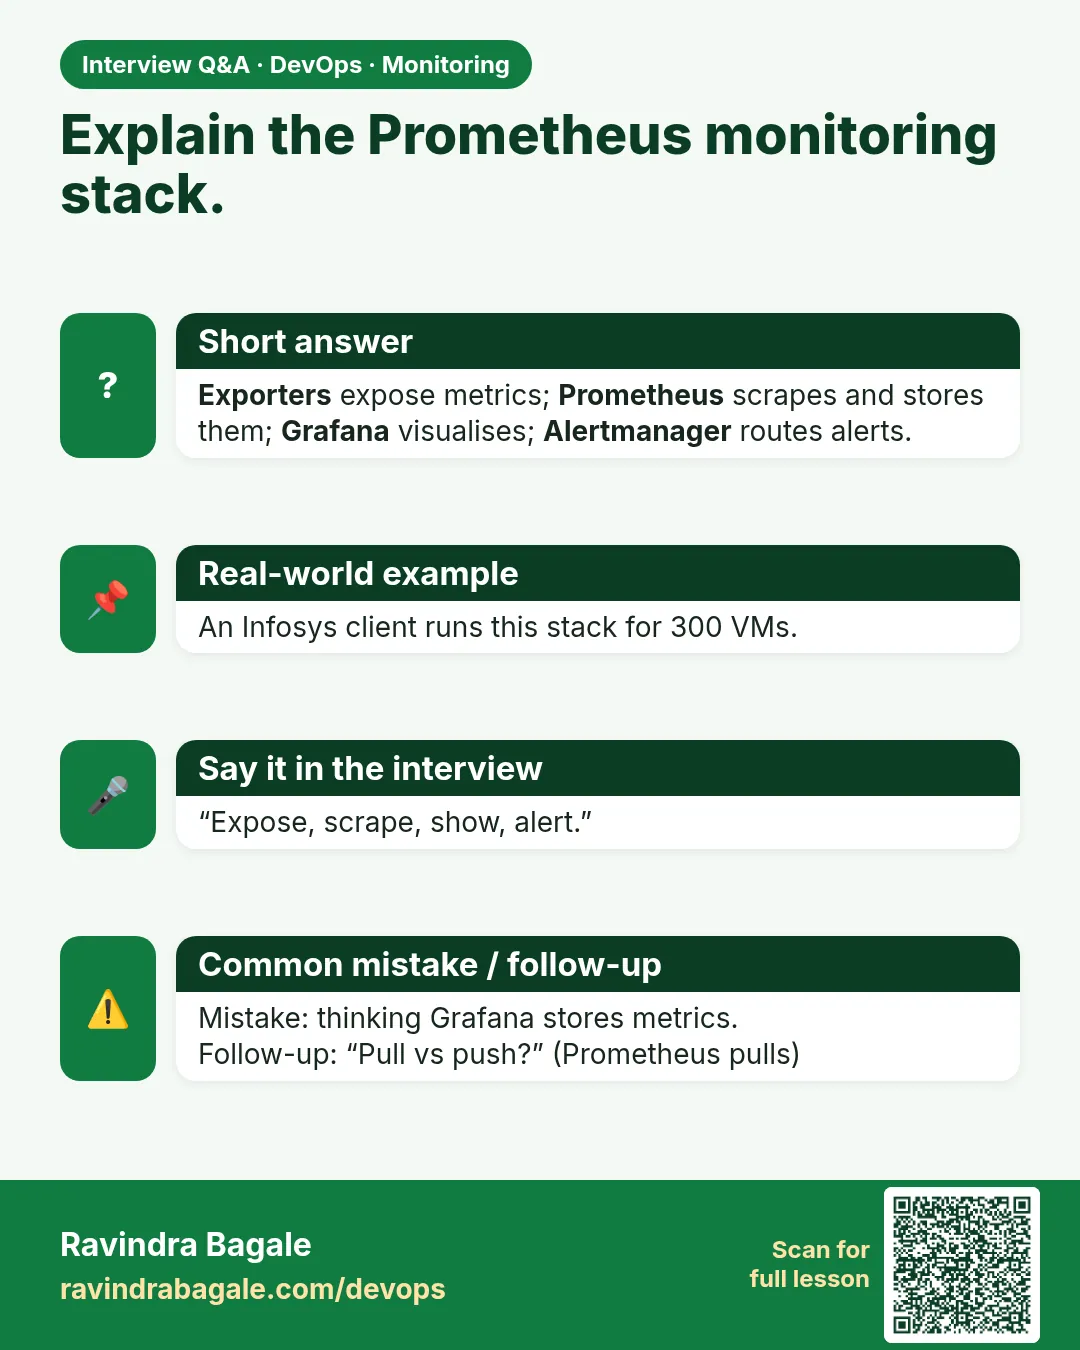
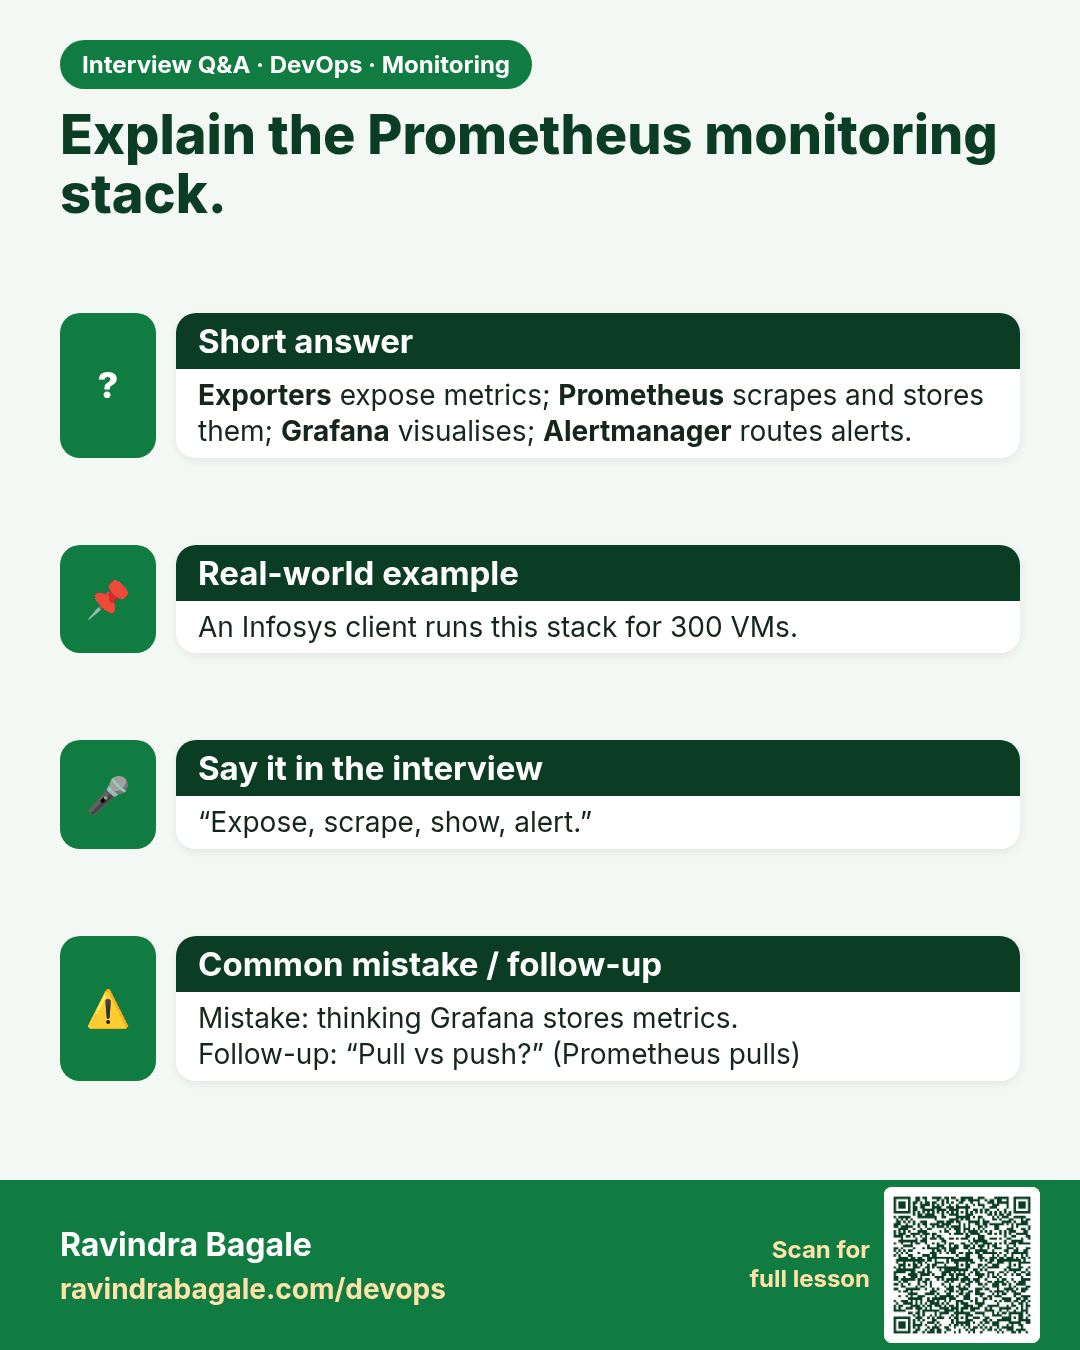
Explain the Prometheus monitoring stack.
Explain the Prometheus monitoring stack. Exporters expose metrics; Prometheus scrapes and stores them; Grafana visualises; Alertmanager routes alerts.
Lesson: 13.4 Primary path — Prometheus + Node Exporter + Grafana · मराठी card