35. More Real-World Project Briefs
35.10 Multi-location
Business question. How do the six cities compare, without pretending two stores in one city are two cities?
Tables. Location (Store, City). The city list is only Pune, Mumbai, Nashik, Sambhaji Nagar, Kolhapur, Nagpur. Fact table at store grain if you have stores, with City as a column on Location, not typed again on the fact. Date.
Measures. The base sales measure, plus a share of total:
Share of All Cities =
DIVIDE([Total Sales], CALCULATE([Total Sales], REMOVEFILTERS(Location)))
A small-multiples line (section 14.22), one panel per city, same Y-axis, is the comparison. A map (Module 15) is optional and only if you have real coordinates you are allowed to use; do not invent precise latitudes and call them official.
Pages. Page one: small multiples by city. Page two: a matrix, city then store, with a sparkline if available. Sync the month slicer (section 22.9). RLS (Module 26) if a manager may see only one city: test View as, or the share of all cities will leak the company total. For a city manager, REMOVEFILTERS does not bypass RLS, which is what you want. Check anyway.
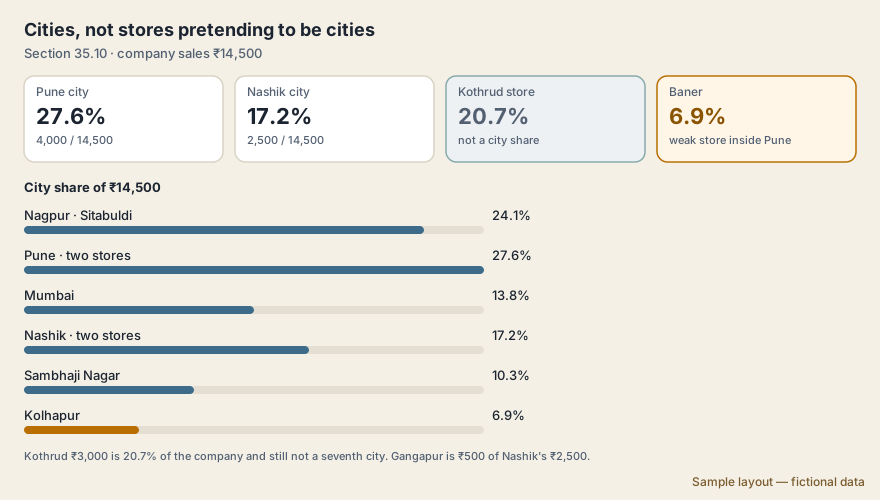
Sample layout — fictional data. The picture uses the worked rows in this brief. It does not add a table.
Worked rows (fictional sample data). Two stores in Pune are one city. Share of all cities is city sales divided by the company total, not store sales divided by the company total and then called a city.
| Store | City | Sales |
|---|---|---|
| Kothrud | Pune | ₹3,000 |
| Baner | Pune | ₹1,000 |
| College Road | Nashik | ₹2,000 |
| Gangapur Road | Nashik | ₹500 |
| Rankala | Kolhapur | ₹1,000 |
| Sitabuldi | Nagpur | ₹3,500 |
| Mumbai store | Mumbai | ₹2,000 |
| Sambhaji store | Sambhaji Nagar | ₹1,500 |
Company sales are ₹14,500. Pune share is (3,000+1,000) ÷ 14,500 = 4,000 ÷ 14,500 = 27.6%. Nashik share is (2,000+500) ÷ 14,500 = 17.2%. Kothrud alone is 3,000 ÷ 14,500 = 20.7%. That is a store share, not a city share.
Starter file: brief_35_10_stores_sales.csv – the worked rows above as a CSV (fictional practice data). Load it with Get data › Text/CSV, build the measures, then check your cards.
Expected values to check
Company ₹14,500 · Pune share 27.6% · Nashik share 17.2% · Kothrud store share 20.7%
| Good KPI | Vanity metric | |
|---|---|---|
| From the same rows | Pune city share 27.6% | Kothrud shown as if it were a city at 20.7% |
| Why | The business question is the six cities. Pune is one bar. | Two Pune bars make Pune look like two markets and make Baner (₹1,000, 6.9%) look like a small city instead of a weak store inside a large one. |
What the manager does. The Pune manager compares 27.6% with Nashik's 17.2%, then drills to stores. Baner is the weak Pune store. The Nashik manager sees College Road carrying almost all of Nashik (2,000 of 2,500) and asks why Gangapur is ₹500. Do not invent a seventh city because a store name sounds important.
Ravindra Bagale's Tip
A common mistake is City on the fact table and City on the store table with no relationship, so Pune becomes two different Punes. Keep City on one dimension only. And test the share-of-total measure under RLS, or the Pune manager may think he sees the whole state total, or the other way round. Use View as. Don't forget this.
Ravindra Bagale's Tip – मराठी
एक common चूक म्हणजे fact table वर City आणि store table वर City, पण relationship नाही, म्हणजे Pune चे दोन वेगळे Pune होतात. City एकाच dimension वर ठेवा. आणि share-of-total measure RLS मध्ये test करा, नाहीतर Pune च्या manager ला वाटेल त्याला पूर्ण राज्याचा total दिसतोय, किंवा उलट. View as वापरा. अजिबात विसरू नका.
Ravindra Bagale's Tip – हिंदी
एक common गलती है fact table पर City और store table पर City, पर कोई relationship नहीं, तो Pune दो अलग Pune बन जाते हैं. City एक ही dimension पर रखो. और share-of-total measure को RLS में test करो, वरना Pune के manager को लगेगा कि उसे पूरे राज्य का total दिख रहा है, या उल्टा. View as इस्तेमाल करो. बिल्कुल मत भूलो.
Thodkyaat sangaycha tar (quick recap)
A brief means questions, tables, measures and pages. In every brief, the worked rows above are fictional sample data. The formula in words first, then the result. Work out the vanity metric from the same rows. The long KPI list, by industry, is in Module 36. Let us go there next.
Brief म्हणजे प्रश्न, tables, measures, pages. प्रत्येक brief मधल्या वरच्या worked rows काल्पनिक sample data आहेत. आधी formula शब्दांत, मग result. Vanity metric त्याच rows मधून काढा. KPI ची लांब यादी, उद्योगानुसार, Module 36 मध्ये आहे. आता पुढे जाऊया तिकडेच.
Brief यानी सवाल, tables, measures, pages. हर brief की ऊपर वाली worked rows काल्पनिक sample data हैं. पहले formula शब्दों में, फिर result. Vanity metric उन्हीं rows से निकालिए. KPI की लंबी सूची, उद्योग के हिसाब से, Module 36 में है. अब वहीं चलते हैं.