35. More Real-World Project Briefs
35.2 Sales Dashboard (Wholesale, Not Quick Commerce)
Pointer. If the question is dark-store delivery sales, stop and use Module 28. This brief is a fictional wholesale counter: kirana shops buy in bulk.
Business question. Which city and which salesperson sold the most this month, and where are we short of a target?
Tables.
| Table | Grain | Example columns |
|---|---|---|
Sale (fact) |
one row per invoice line | Invoice ID, Date, City, Salesperson, Product ID, Qty, Amount |
Product |
one product | Product ID, Name, Category |
Salesperson |
one person | Name (only the class names), City |
Date |
one day | the marked date table from Module 11 |
CityTarget |
city and month | City, Month Start, Target Amount |
Fictional lines you can type with Enter data: 2 April, Pune, Ravindra Bagale, ₹4,000; 2 April, Nashik, Shraddha Bagale, ₹2,500; 3 April, Kolhapur, Raja, ₹1,000. Targets are practice numbers you type, not a company plan.
Measures.
Total Sales = SUM(Sale[Amount])
Target = SUM(CityTarget[Target Amount])
Variance = [Total Sales] - [Target]
Achievement % = DIVIDE([Total Sales], [Target])
Relate CityTarget carefully. If the grain is city-month, do not join it directly to Sale on city alone (that is a many-to-many). Use a Month key on Date or the TREATAS pattern in section 13.22.
Pages. One executive page: cards for Sales, Target, Variance, Achievement %; a column chart by city; a table by salesperson. A second page: product category. Slicers: month, city.
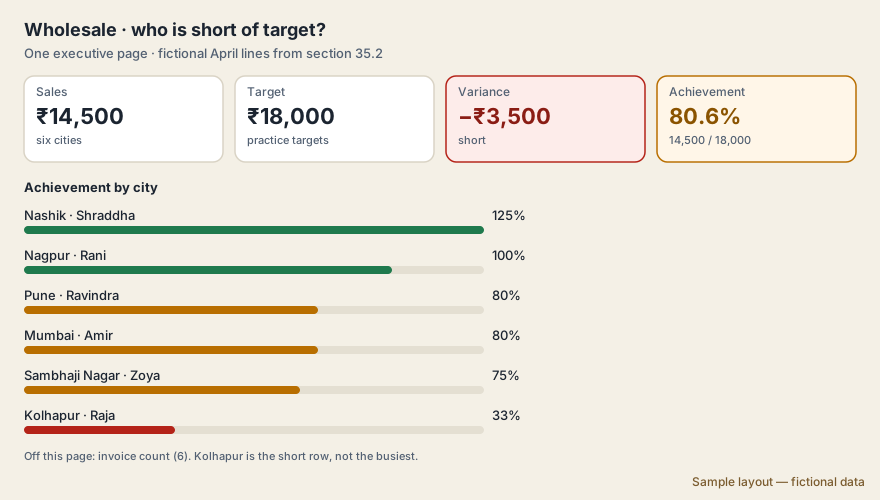
Sample layout — fictional data. The picture uses the worked rows in this brief. It does not add a table.
Worked rows (fictional sample data). Not a company target. The first three amounts are the lines already in this brief.
| City | Salesperson | Sales | Target |
|---|---|---|---|
| Pune | Ravindra Bagale | ₹4,000 | ₹5,000 |
| Nashik | Shraddha Bagale | ₹2,500 | ₹2,000 |
| Kolhapur | Raja | ₹1,000 | ₹3,000 |
| Nagpur | Rani | ₹3,500 | ₹3,500 |
| Mumbai | Amir | ₹2,000 | ₹2,500 |
| Sambhaji Nagar | Zoya | ₹1,500 | ₹2,000 |
Achievement % is sales divided by target. Sales are ₹4,000+₹2,500+₹1,000+₹3,500+₹2,000+₹1,500 = ₹14,500. Target is ₹5,000+₹2,000+₹3,000+₹3,500+₹2,500+₹2,000 = ₹18,000. Achievement is 14,500 ÷ 18,000 = 80.6%. Variance is 14,500 − 18,000 = −₹3,500 (short of target).
Pune is 4,000 ÷ 5,000 = 80%. Nashik is 2,500 ÷ 2,000 = 125%.
Starter file: brief_35_2_wholesale_sales.csv – the worked rows above as a CSV (fictional practice data). Load it with Get data › Text/CSV, build the measures, then check your cards.
Expected values to check
Sales ₹14,500 · Target ₹18,000 · Achievement 80.6% · Variance −₹3,500 · Pune 80%, Nashik 125%
| Good KPI | Vanity metric | |
|---|---|---|
| From the same rows | Achievement 80.6%, and Nashik 125% against Pune 80% | 6 invoices |
| Why | The company is short ₹3,500. Nashik is the only one of these two cities over target. | Six rows looks like "activity". Raja's ₹1,000 against a ₹3,000 target is the Kolhapur problem, and the invoice count treats it as equal to Pune. |
What the manager does. The Pune manager does not average himself with Nashik and call the week fine. He is ₹1,000 short of a practice target. The Nashik manager asks Shraddha which account repeated, and does not cut her target because the company card is red. Kolhapur is ₹2,000 short on one row. That is a conversation, not a new chart.
Ravindra Bagale's Tip
If you only link the target table to city, the monthly target gets duplicated on every day. Remember that the grain is month, and always test the relationship on a single month. Don't make this mistake!
Ravindra Bagale's Tip – मराठी
Target table फक्त city ला जोडलं तर महिन्याचा target प्रत्येक दिवसाला duplicate होतो. Grain month आहे हे लक्षात ठेवा, आणि relationship नक्की एकाच महिन्यावर test करा. चूक करू नका!
Ravindra Bagale's Tip – हिंदी
Target table को सिर्फ़ city से जोड़ा तो महीने का target हर दिन पर duplicate हो जाता है. Grain month है यह याद रखो, और relationship ज़रूर एक ही महीने पर test करो. ग़लती मत करो!