35. More Real-World Project Briefs
35.5 Financial Dashboard (Budget versus Actual)
Business question. For each city and month, what is actual spend against budget, and what is the variance?
Tables. Actual (Date, City, Account, Amount). Budget (Month Start, City, Account, Budget Amount). Account dimension (Rent, Wages, Delivery cost are enough labels). Date.
Measures.
Actual Spend = SUM(Actual[Amount])
Budget Amount = SUM(Budget[Budget Amount])
Variance = [Budget Amount] - [Actual Spend]
Variance % = DIVIDE([Variance], [Budget Amount])
Decide the sign in writing: here a positive variance means under budget. Put that sentence on the page. A waterfall (section 14.8) of accounts for one city is the right visual. A pie of the whole company is not.
Pages. Slicers: month, city. Cards: Actual, Budget, Variance. A clustered column, Actual beside Budget, by account. A table with conditional formatting on Variance % (section 20.6).
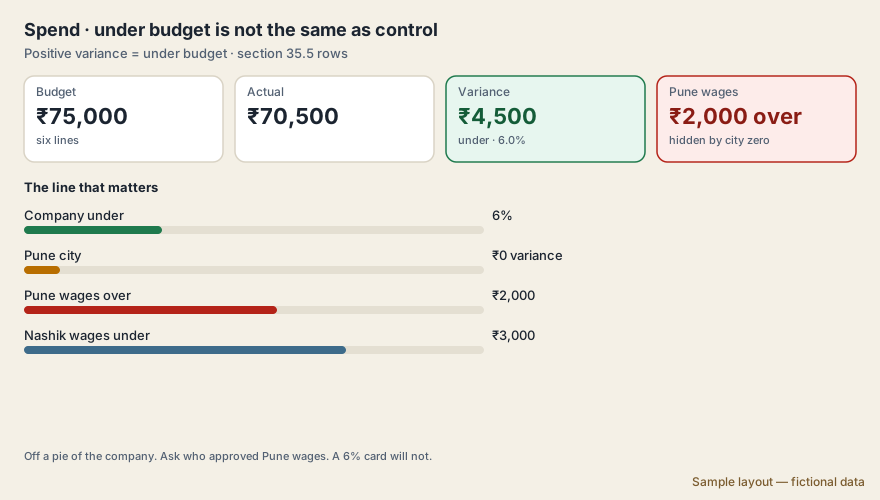
Sample layout — fictional data. The picture uses the worked rows in this brief. It does not add a table.
Fictional check: Pune rent budget ₹10,000, actual ₹8,000, variance ₹2,000, 20%. If your card shows 80%, you divided actual by budget and labelled it variance. Fix the measure, not the title.
Worked rows (fictional sample data). Positive variance means under budget (budget minus actual), as in the measure above. The Pune rent line is the check already in this section: variance ₹2,000, which is 2,000 ÷ 10,000 = 20%.
| City | Account | Budget | Actual |
|---|---|---|---|
| Pune | Rent | ₹10,000 | ₹8,000 |
| Pune | Wages | ₹20,000 | ₹22,000 |
| Nashik | Rent | ₹7,000 | ₹7,000 |
| Nashik | Wages | ₹15,000 | ₹12,000 |
| Kolhapur | Delivery | ₹5,000 | ₹6,500 |
| Nagpur | Wages | ₹18,000 | ₹15,000 |
Budget is ₹75,000. Actual is ₹70,500. Variance is 75,000 − 70,500 = ₹4,500 under budget. Variance % is 4,500 ÷ 75,000 = 6.0%.
Pune city is budget ₹30,000 and actual ₹30,000. Variance ₹0. Rent is ₹2,000 under and wages are ₹2,000 over. Nashik wages are 15,000 − 12,000 = ₹3,000 under.
Starter file: brief_35_5_budget_vs_actual.csv – the worked rows above as a CSV (fictional practice data). Load it with Get data › Text/CSV, build the measures, then check your cards.
Expected values to check
Budget ₹75,000 · Actual ₹70,500 · Variance ₹4,500 under budget · Variance % 6.0% · Pune variance ₹0
| Good KPI | Vanity metric | |
|---|---|---|
| From the same rows | Pune wages ₹2,000 over budget | Company variance ₹4,500 under (6%) |
| Why | The wage line needs a name. The city total of zero hides it. | 6% under looks like control. Nashik and Nagpur underspent. Pune wages did not. |
What the manager does. The Pune finance lead asks who approved the extra ₹2,000 of wages, and does not "explain" it with cheaper rent. The Nashik lead asks whether ₹3,000 less wages is a vacant seat. A vacant seat with the same delivery promise is not a saving until the roster is checked.
Ravindra Bagale's Tip
Many students use the same Amount column for budget and actual and tell them apart with a slicer the reader can clear. Use two tables and two measures. The variance must stay correct even when the slicer is cleared. Pay attention!
Ravindra Bagale's Tip – मराठी
बरेच students budget आणि actual साठी एकच Amount column वापरतात आणि वाचणारा clear करू शकेल अशा slicer ने ते वेगळे करतात. दोन tables, दोन measures. Slicer clear झाला तरी variance बरोबर राहिला पाहिजे. लक्षात ठेवा!
Ravindra Bagale's Tip – हिंदी
बहुत से students budget और actual के लिए एक ही Amount column इस्तेमाल करते हैं और ऐसे slicer से अलग करते हैं जिसे पढ़ने वाला clear कर सकता है. दो tables, दो measures. Slicer clear होने पर भी variance सही रहना चाहिए. ध्यान रखो!