51.1 Data Types and Dirty Data Cleaning
Chala mitrano — data can be very dirty. We learn every Power BI data type, then clean blanks, bad dates, mixed units, PDF junk and more — step by step.
चला मित्रांनो — data खूप गलिच्छ असू शकतो. प्रत्येक Power BI data type शिकू, मग blanks, चुकीच्या dates, mixed units, PDF junk स्वच्छ करू — पाऊल दर पाऊल.
चला मित्रों — डेटा बहुत गंदा हो सकता है। हर Power BI data type सीखें, फिर blanks, गलत dates, mixed units, PDF junk साफ़ करें — क़दम दर क़दम।
- Name every common Power Query data type and when to use it.
- Fix locale pitfalls for dates, decimals and currency symbols.
- Clean blanks, placeholders, spaces, case, spelling and duplicates.
- Repair numbers-as-text, mixed dates, Excel serials and bracket negatives.
- Reshape merged headers, totals, crosstabs (unpivot), splits and merges.
- Normalise units and currencies; protect leading zeros and UTF-8 text.
- Handle orphans, folder combine, JSON, PDF junk, time zones and fiscal years.
- Use column profiling and a quality checklist before Close & Apply.
Start with a problem (fictional). Priya opened a fictional Pune Kirana Weekly Excel from store managers. It had a title row, Bombay and mumbai mixed, ₹ and $ in one column, Excel serial dates, a Total row, a repeated header in the middle, PIN codes that lost zeros, and one OrderId typed ORD-100l. The CEO dashboard was wrong by lakhs. She needs types + a cleanup playbook.
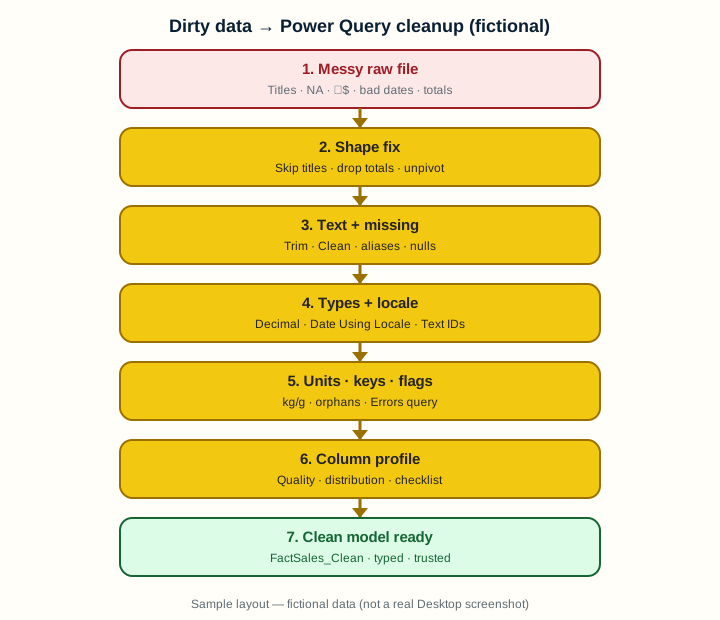
1. Why data types decide if your report is true
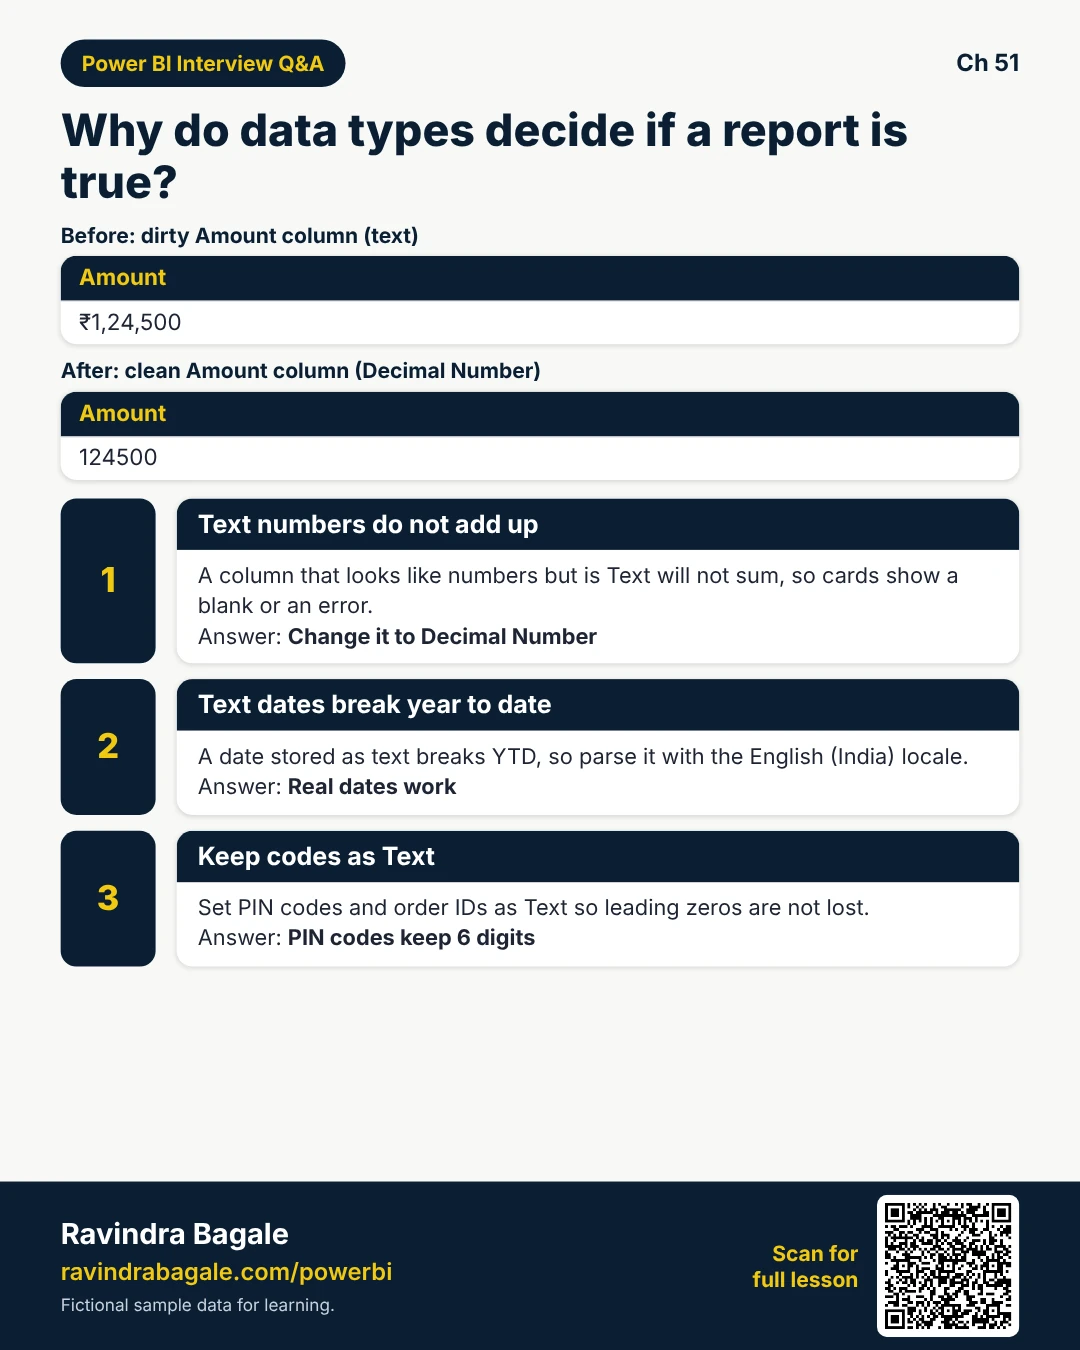
Why: A column that looks like numbers but is Text will not sum. A date that is Text will break YTD. Wrong types silently lie.
What: In Power BI, every column has a data type (Text, Whole Number, Decimal, Date, True/False, and more). Power Query sets types when you import. The model uses those types for filters, relationships, and DAX.
How — check types first:
Vertical steps (one under another)
- Open Power Query (Transform data).
- Look at the icon under each column header (ABC, 123, calendar, T/F).
- Click a column — Home / Transform — Data Type — set the correct type.
- If the change fails, fix dirty values first, then set the type.
- Close & Apply, then check a simple SUM or date slicer.
Tiny example: Pune kirana sheet: Amount shows as ABC (Text). Card shows blank or error. Change to Decimal Number, then card shows ₹1,24,500 (fictional).
Ravindra Bagale's Tip
Friends, never trust auto-detect alone. Always open Power Query and read the column icons.
Ravindra Bagale's Tip – मराठी
मित्रांनो, auto-detect वर एकटा विश्वास ठेवू नका. Power Query उघडा आणि column icons वाचा.
Ravindra Bagale's Tip – हिंदी
दोस्तों, सिर्फ़ auto-detect पर भरोसा न करें। Power Query खोलें और column icons पढ़ें।
2. Every Power BI / Power Query data type
Why: Interviews and real files expect you to name types and pick the right one.
What: These are the main types you set in Power Query. Icons sit under the column name.
How — match type to meaning:
Vertical steps (one under another)
- Text for labels and codes that must not become numbers (PIN, phone, order id with leading zeros).
- Whole Number for counts; Decimal for money and measures that need fractions.
- Fixed Decimal when you need currency-style fixed precision.
- Percentage for rates stored as fractions (0.18).
- Date / Time / DateTime / DateTimeZone / Duration for time fields — pick the narrowest that fits.
- True/False for yes/no flags. Avoid Binary in star-schema facts.
Tiny example: MH PIN 411001 must stay Text. If it becomes Whole Number, leading zeros vanish, then 411001 still ok for Pune, but 001234 becomes 1234 (broken id).
Ravindra Bagale's Tip
Friends, PIN codes, GSTIN, and employee IDs are Text — even when they look numeric.
Ravindra Bagale's Tip – मराठी
मित्रांनो, PIN, GSTIN, employee ID हे Text आहेत — संख्या दिसली तरी.
Ravindra Bagale's Tip – हिंदी
दोस्तों, PIN, GSTIN, employee ID टेक्स्ट हैं — संख्या दिखे तो भी।
| Type | Icon idea | Use for | Tiny example |
|---|---|---|---|
| Text | ABC | Names, cities, IDs that must keep leading zeros (PIN 411001) | City = "Pune" |
| Whole Number | 123 | Counts, qty without fractions | Qty = 12 |
| Decimal Number | 1.2 | Most measures: sales, weight, rate | GMV = 124500.50 |
| Fixed Decimal (Currency) | ₹ | Money with 4 decimal precision fixed | Price = 99.9900 |
| Percentage | % | Rates stored as 0.18, then shows 18% | GST = 0.18 |
| Date | 📅 | Calendar day only | 2026-03-04 |
| Time | ⏱ | Time of day | 14:30:00 |
| Date/Time | 📅⏱ | Timestamp | 2026-03-04 14:30 |
| Date/Time/Zone | 🌐 | Timestamp + offset | 2026-03-04 14:30+05:30 |
| Duration | ⏳ | Length of time | 1.02:30:00 |
| True/False | T/F | Flags | IsActive = TRUE |
| Binary | ⚙ | Files, images (rare in models) | blob |
About this data: Examples use fictional Pune / Nashik retail numbers for learning only.
3. Auto-detection pitfalls and locale (dates, commas, currency)
Why: 03/04 can mean 3 April (India/UK) or March 4 (US). 1.234,56 vs 1,234.56. ₹ $ £ € symbols confuse type detect.
What: Power Query uses a locale when it guesses types. Wrong locale, then wrong dates, wrong decimals, failed type changes.
How — set locale and parse safely:
Vertical steps (one under another)
- File — Options — Current file — Regional settings — set locale (e.g. English India) to match the file.
- Or: change type Using Locale… (right-click column) — pick type + locale.
- For mixed currency symbols: strip symbols with Replace Values / Text.Select, then Decimal.
- Never assume 03/04 — ask the source owner which day is month.
- Prefer ISO dates in clean models: yyyy-mm-dd.
Tiny example: CSV from London office: 04/03/2026 means 4 March. US locale reads April 3 — YoY chart shifts by a month (fictional Contoso UK vs US).
Ravindra Bagale's Tip
Friends, Using Locale is interview gold. Say: I change type with locale, I do not guess 03/04.
Ravindra Bagale's Tip – मराठी
मित्रांनो, Using Locale interview सोने आहे. सांगा: locale सोबत type बदलतो, 03/04 अंदाज नाही.
Ravindra Bagale's Tip – हिंदी
दोस्तों, Using Locale interview सोना है। कहें: locale के साथ type बदलता हूँ, 03/04 अंदाज़ा नहीं।
Locale: Indian date vs US date
About this data: Fictional Blinkit-style order extract for Maharashtra training.
Why it happens: File made in India (dd/mm/yyyy). Auto US locale swaps day/month.
Before (dirty)
| OrderDate_raw |
|---|
| 03/04/2026 |
After (clean)
| OrderDate |
|---|
| 2026-04-03 |
Power Query steps (vertical):
- Select OrderDate_raw
- Data Type — Using Locale — Date — English (India)
- Rename to OrderDate
- Verify sample rows against the source email
// M idea
= Table.TransformColumns(Source, {{"OrderDate_raw", each Date.From(_, "en-IN"), type date}})
4. Nulls, blanks and placeholder junk
Why: Empty cells and NA/- break averages and relationships.
What: Treat blank, null, NA, dash, and fake zero as different stories — ask the business before you replace.
How — clean missing values:
Vertical steps (one under another)
- Profile the column (section 11)
- Replace placeholders with null or a label
- Decide null vs 0 with the owner
- Document the rule in the query name
Tiny example: HR Status NA, then (missing); GMV blank, then ask before zero (fictional Acme Pune).
Ravindra Bagale's Tip
Friends, zero and missing are not the same. Replacing blindly breaks KPIs.
Ravindra Bagale's Tip – मराठी
मित्रांनो, zero आणि missing एक नाहीत. अंधाने replace केल्याने KPI मोडतात.
Ravindra Bagale's Tip – हिंदी
दोस्तों, zero और missing एक नहीं। अंधा replace KPI तोड़ता है।
Blanks and nulls
About this data: Fictional city GMV for Pune kirana chain.
Why it happens: Export left empty cells; systems store missing as null.
Before (dirty)
| City | GMV |
|---|---|
| Pune | 45000 |
| 12000 | |
| Nashik |
After (clean)
| City | GMV |
|---|---|
| Pune | 45000 |
| (unknown) | 12000 |
| Nashik | 0 |
Power Query steps (vertical):
- Replace Values on City: null/blank, then "(unknown)" (or remove rows if policy says so)
- Replace null GMV with 0 only if business agrees missing means zero
- Or keep null and use DAX that handles BLANK()
= Table.ReplaceValue(Source, null, "(unknown)", Replacer.ReplaceValue, {"City"})Placeholders: NA, -, 0, N/A, #N/A
About this data: Fictional HR status sheet from Acme Pune.
Why it happens: Excel users type NA or dash when they do not know the value. Zero may mean missing, not real zero.
Before (dirty)
| Status |
|---|
| NA |
| - |
| 0 |
| Active |
After (clean)
| Status |
|---|
| (missing) |
| (missing) |
| (missing) |
| Active |
Power Query steps (vertical):
- Replace Values: "NA", "N/A", "-", "#N/A", then null or "(missing)"
- Ask business: is 0 a real zero or a placeholder?
- Do not average placeholders as numbers
= Table.ReplaceValue(Source, "NA", null, Replacer.ReplaceValue, {"Status"})5. Spaces, case, spelling and duplicates
Why: Looks-the-same text fails relationships and distinct counts.
What: Trim/Clean first. Then standardise spelling with a map. Then remove true duplicate keys.
How — normalise text:
Vertical steps (one under another)
- Trim + Clean
- Standardise case
- Replace known aliases (Bombay, then Mumbai)
- Distinct on real keys
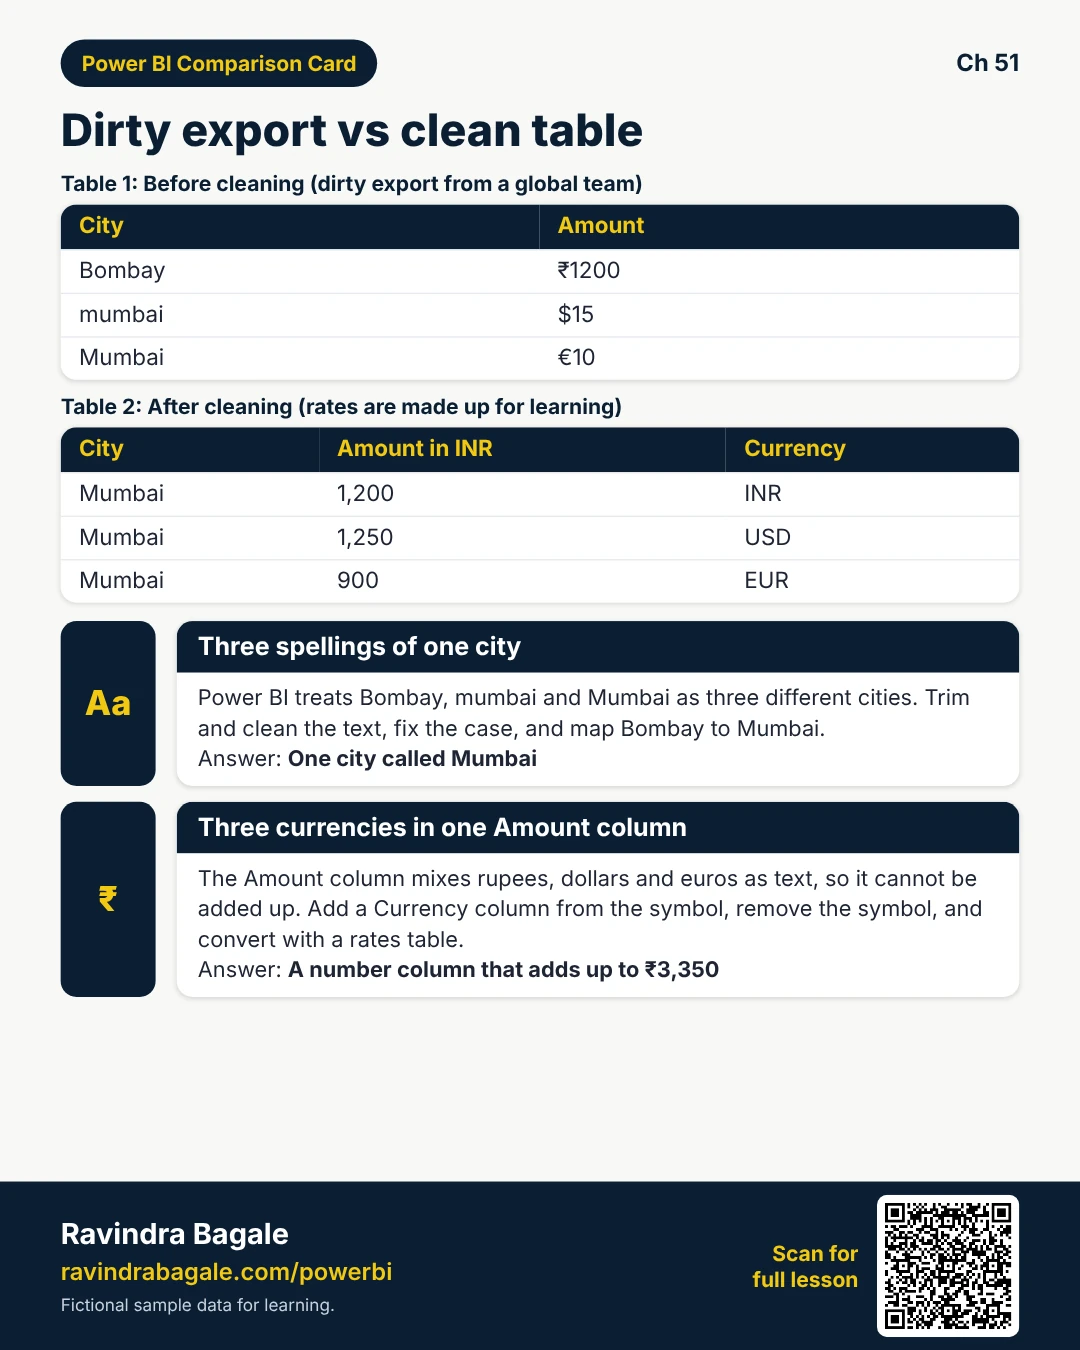
Tiny example: Bombay / mumbai / Mumbai, then Mumbai; OrderId A1 duplicated (fictional).
Ravindra Bagale's Tip
Friends, Trim + Clean before any fuzzy match. Garbage in, fuzzy mess out.
Ravindra Bagale's Tip – मराठी
मित्रांनो, fuzzy आधी Trim + Clean. Garbage in = fuzzy mess.
Ravindra Bagale's Tip – हिंदी
दोस्तों, fuzzy से पहले Trim + Clean। Garbage in = fuzzy mess।
Extra spaces and non-printing characters
About this data: Fictional customer list — Indian and German names.
Why it happens: Copy-paste from web/PDF leaves NBSP and double spaces.
Before (dirty)
| Customer |
|---|
| Ravi Patil |
| Sofia Müller |
After (clean)
| Customer |
|---|
| Ravi Patil |
| Sofia Müller |
Power Query steps (vertical):
- Transform — Format — Trim
- Transform — Format — Clean (removes non-printable)
- Replace " " with " " in a loop if needed
= Table.TransformColumns(Source, {{"Customer", Text.Clean}, {"Customer", Text.Trim}})Inconsistent case and spelling (Mumbai/Bombay/mumbai)
About this data: Fictional logistics cities — India.
Why it happens: Old name Bombay still typed; case differs by who typed.
Before (dirty)
| City |
|---|
| Mumbai |
| Bombay |
| mumbai |
| MUMBAI |
After (clean)
| City |
|---|
| Mumbai |
| Mumbai |
| Mumbai |
| Mumbai |
Power Query steps (vertical):
- Format — Capitalize Each Word (or UPPER then map)
- Replace Values: Bombay, then Mumbai
- Keep a mapping table CityAlias, then CityCanonical for many aliases
= Table.ReplaceValue(Source, "Bombay", "Mumbai", Replacer.ReplaceText, {"City"})Duplicates — exact and near
About this data: Fictional orders — Contoso training.
Why it happens: Double export or same person typed two ways.
Before (dirty)
| OrderId | Customer |
|---|---|
| A1 | Ravi |
| A1 | Ravi |
| A2 | Ravi Patil |
After (clean)
| OrderId | Customer |
|---|---|
| A1 | Ravi |
| A2 | Ravi Patil |
Power Query steps (vertical):
- Home — Remove Rows — Remove Duplicates on OrderId (exact)
- For near-duplicates: Trim/Clean/lowercase first, then fuzzy merge or mapping table
- Never remove duplicates blindly on name alone — two customers can share a name
= Table.Distinct(Source, {"OrderId"})6. Numbers-as-text, date chaos, serials and brackets
Why: Wrong types and formats break SUM, YTD and joins.
What: Strip symbols, parse with locale, convert Excel serials, turn (1,200) into -1200.
How — fix types:
Vertical steps (one under another)
- Strip currency and thousands separators
- Using Locale for dates
- Serial, then Date
- Brackets, then negative
Tiny example: ₹12,450 text, then 12450 decimal; Excel 45321, then date (fictional).
Ravindra Bagale's Tip
Friends, if Change Type shows errors, fix values first — do not only Replace Errors and forget.
Ravindra Bagale's Tip – मराठी
मित्रांनो, Change Type errors दिसले तर आधी values दुरुस्त करा — फक्त Replace Errors विसरू नका.
Ravindra Bagale's Tip – हिंदी
दोस्तों, Change Type errors दिखें तो पहले values ठीक करें — सिर्फ़ Replace Errors न भूलें।
Numbers stored as text
About this data: Fictional Mumbai fashion boutique sales.
Why it happens: CSV exports quote numbers; users type currency symbols.
Before (dirty)
| Amount |
|---|
| "12,450" |
| ₹ 9,900 |
| 1200 |
After (clean)
| Amount |
|---|
| 12450 |
| 9900 |
| 1200 |
Power Query steps (vertical):
- Replace "," and "₹" and spaces with empty
- Change type to Decimal Number
- If errors: use Replace Errors or split bad rows to an Errors query
= Table.TransformColumns(Source, {{"Amount", each Number.From(Text.Replace(Text.Replace(_, "₹", ""), ",", "")), type number}})Mixed date formats in one column
About this data: Fictional multi-branch retail dates.
Why it happens: Three teams pasted into one Excel column with different habits.
Before (dirty)
| OrderDate |
|---|
| 03-Apr-2026 |
| 2026/04/05 |
| 04/06/2026 |
After (clean)
| OrderDate |
|---|
| 2026-04-03 |
| 2026-04-05 |
| 2026-06-04 |
Power Query steps (vertical):
- Try Change Type Using Locale for the majority format
- For stubborn rows: add a custom column with Date.FromText and culture
- Or split sources and append after each is parsed
= Table.AddColumn(Source, "OrderDate2", each try Date.FromText([OrderDate], "en-GB") otherwise Date.FromText([OrderDate], "en-US"))Excel serial dates (45000 looks like a number)
About this data: Fictional Excel dump from warehouse.
Why it happens: Excel stores dates as day counts from 1899-12-30. Export as number, then serial appears.
Before (dirty)
| OrderDate |
|---|
| 45321 |
| 45322 |
After (clean)
| OrderDate |
|---|
| 2024-01-30 |
| 2024-01-31 |
Power Query steps (vertical):
- Change type to Date (Power Query understands Excel serials when typed as number then Date)
- If text serial: Number.From then Date.From
- Verify against a known holiday row
= Table.TransformColumns(Source, {{"OrderDate", each Date.From(Number.From(_)), type date}})Negative numbers in brackets accounting style
About this data: Fictional finance sheet — JP Morgan style training numbers (made up).
Why it happens: Finance Excel shows credits in parentheses.
Before (dirty)
| Amount |
|---|
| (1,200) |
| 3,400 |
After (clean)
| Amount |
|---|
| -1200 |
| 3400 |
Power Query steps (vertical):
- Replace "(" with "-" and ")" with ""
- Remove thousands commas
- Decimal type
= Table.TransformColumns(Source, {{"Amount", each Number.From(Text.Replace(Text.Replace(Text.Replace(_, "(", "-"), ")", ""), ",", "")), type number}})7. Shape problems: headers, totals, unpivot, split, merge
Why: Pretty Excel reports are not data tables.
What: Skip title rows, kill mid-file headers and totals, unpivot crosstabs, split packed cells, merge name parts.
How — reshape to tall clean facts:
Vertical steps (one under another)
- Remove top junk rows, then Promote Headers
- Filter header/total repeats
- Unpivot month columns
- Split / Merge as needed
Tiny example: Jan/Feb columns, then City, Month, GMV tall table (fictional MH).
Ravindra Bagale's Tip
Friends, if months are columns, Unpivot before you model. Star schemas want tall facts.
Ravindra Bagale's Tip – मराठी
मित्रांनो, महिने columns असतील तर model आधी Unpivot. Star schema ला tall facts हवेत.
Ravindra Bagale's Tip – हिंदी
दोस्तों, महीने columns हों तो model से पहले Unpivot। Star schema को tall facts चाहिए।
Merged cells and multi-row headers
About this data: Fictional West region print report.
Why it happens: Excel report layout for printing — not a flat table.
Before (dirty)
| Col1 | Col2 |
|---|---|
| Region: West | |
| City | GMV |
| Pune | 10 |
After (clean)
| City | GMV |
|---|---|
| Pune | 10 |
Power Query steps (vertical):
- Use first rows carefully: Remove Top Rows until real header
- Promote Headers
- Unmerge in Excel first when possible — Power Query hates merged cells
- Fill Down if category labels sit in merged blocks
= Table.PromoteHeaders(Table.Skip(Source, 2))Header rows repeated mid-file
About this data: Fictional stacked monthly exports.
Why it happens: Someone copied monthly blocks stacked with a fresh header each time.
Before (dirty)
| City | GMV |
|---|---|
| Pune | 10 |
| City | GMV |
| Nashik | 8 |
After (clean)
| City | GMV |
|---|---|
| Pune | 10 |
| Nashik | 8 |
Power Query steps (vertical):
- Filter rows where City <> "City"
- Or remove rows that match header text
= Table.SelectRows(Source, each [City] <> "City")Totals and subtotal rows inside data
About this data: Fictional city GMV with Excel total.
Why it happens: Excel SUM at bottom gets imported as a data row, then double-counts.
Before (dirty)
| City | GMV |
|---|---|
| Pune | 10 |
| Nashik | 8 |
| Total | 18 |
After (clean)
| City | GMV |
|---|---|
| Pune | 10 |
| Nashik | 8 |
Power Query steps (vertical):
- Filter out City = "Total" / "Subtotal" / "Grand Total"
- Never leave total rows in fact tables
= Table.SelectRows(Source, each not List.Contains({"Total","Subtotal","Grand Total"}, [City]))Pivoted / crosstab layout — Unpivot
About this data: Fictional MH city month matrix.
Why it happens: Managers love months across columns; models need tall facts.
Before (dirty)
| City | Jan | Feb |
|---|---|---|
| Pune | 10 | 12 |
| Nashik | 8 | 9 |
After (clean)
| City | Month | GMV |
|---|---|---|
| Pune | Jan | 10 |
| Pune | Feb | 12 |
| Nashik | Jan | 8 |
| Nashik | Feb | 9 |
Power Query steps (vertical):
- Select City
- Transform — Unpivot Other Columns
- Rename Attribute, then Month, Value, then GMV
- Set types
= Table.UnpivotOtherColumns(Source, {"City"}, "Month", "GMV")Several values in one cell — Split
About this data: Fictional product tags.
Why it happens: People pack lists into one Excel cell with ; or ,
Before (dirty)
| Tags |
|---|
| kirana;snacks;tea |
After (clean)
| Tags.1 | Tags.2 | Tags.3 |
|---|---|---|
| kirana | snacks | tea |
Power Query steps (vertical):
- Split Column by Delimiter (;)
- Or Split into rows if you need one tag per fact row
= Table.SplitColumn(Source, "Tags", Splitter.SplitTextByDelimiter(";", QuoteStyle.Csv), {"Tags.1","Tags.2","Tags.3"})One value across columns — Merge
About this data: Fictional CRM contacts.
Why it happens: CRM exports first/last separately; label needs full name.
Before (dirty)
| First | Last |
|---|---|
| Ravi | Patil |
After (clean)
| FullName |
|---|
| Ravi Patil |
Power Query steps (vertical):
- Select First + Last
- Merge Columns with space separator
- Or add custom column Text.Combine
= Table.AddColumn(Source, "FullName", each Text.Trim([First] & " " & [Last]), type text)8. Units, currency mix, outliers, leading zeros, encoding
Why: Real warehouse and global files mix units and scripts.
What: Normalise units to one measure, split currency code, flag impossible values, keep PIN as Text, import UTF-8.
How — normalise measures and text safety:
Vertical steps (one under another)
- Parse number + unit, then one base unit
- Currency symbol, then code + amount
- Flag outliers to Errors query
- Text for IDs with leading zeros
- UTF-8 for Marathi/Hindi
Tiny example: 5kg and 5000 g, then 5 WeightKg; PIN 001234 stays text (fictional).
Ravindra Bagale's Tip
Friends, leading zeros die when type becomes number. Set Text first.
Ravindra Bagale's Tip – मराठी
मित्रांनो, number type होताच leading zeros मरतात. आधी Text ठेवा.
Ravindra Bagale's Tip – हिंदी
दोस्तों, number type होते ही leading zeros मर जाते हैं। पहले Text रखें।
Units mixed in values (5kg, 5000 g)
About this data: Fictional grocery weights — Pune DC.
Why it happens: Warehouse staff type unit beside the number.
Before (dirty)
| Weight |
|---|
| 5kg |
| 5000 g |
| 2.5 KG |
After (clean)
| WeightKg |
|---|
| 5 |
| 5 |
| 2.5 |
Power Query steps (vertical):
- Extract number with Text parsing
- Detect unit (kg vs g) and convert grams / 1000
- Store unit in a separate column if needed
- Type Decimal
= Table.AddColumn(Source, "WeightKg", each let t=Text.Lower(_), n=Number.From(Text.Select(t, {"0".."9","."})) in if Text.Contains(t,"g") and not Text.Contains(t,"kg") then n/1000 else n)Currency symbols mixed (₹ $ £ €)
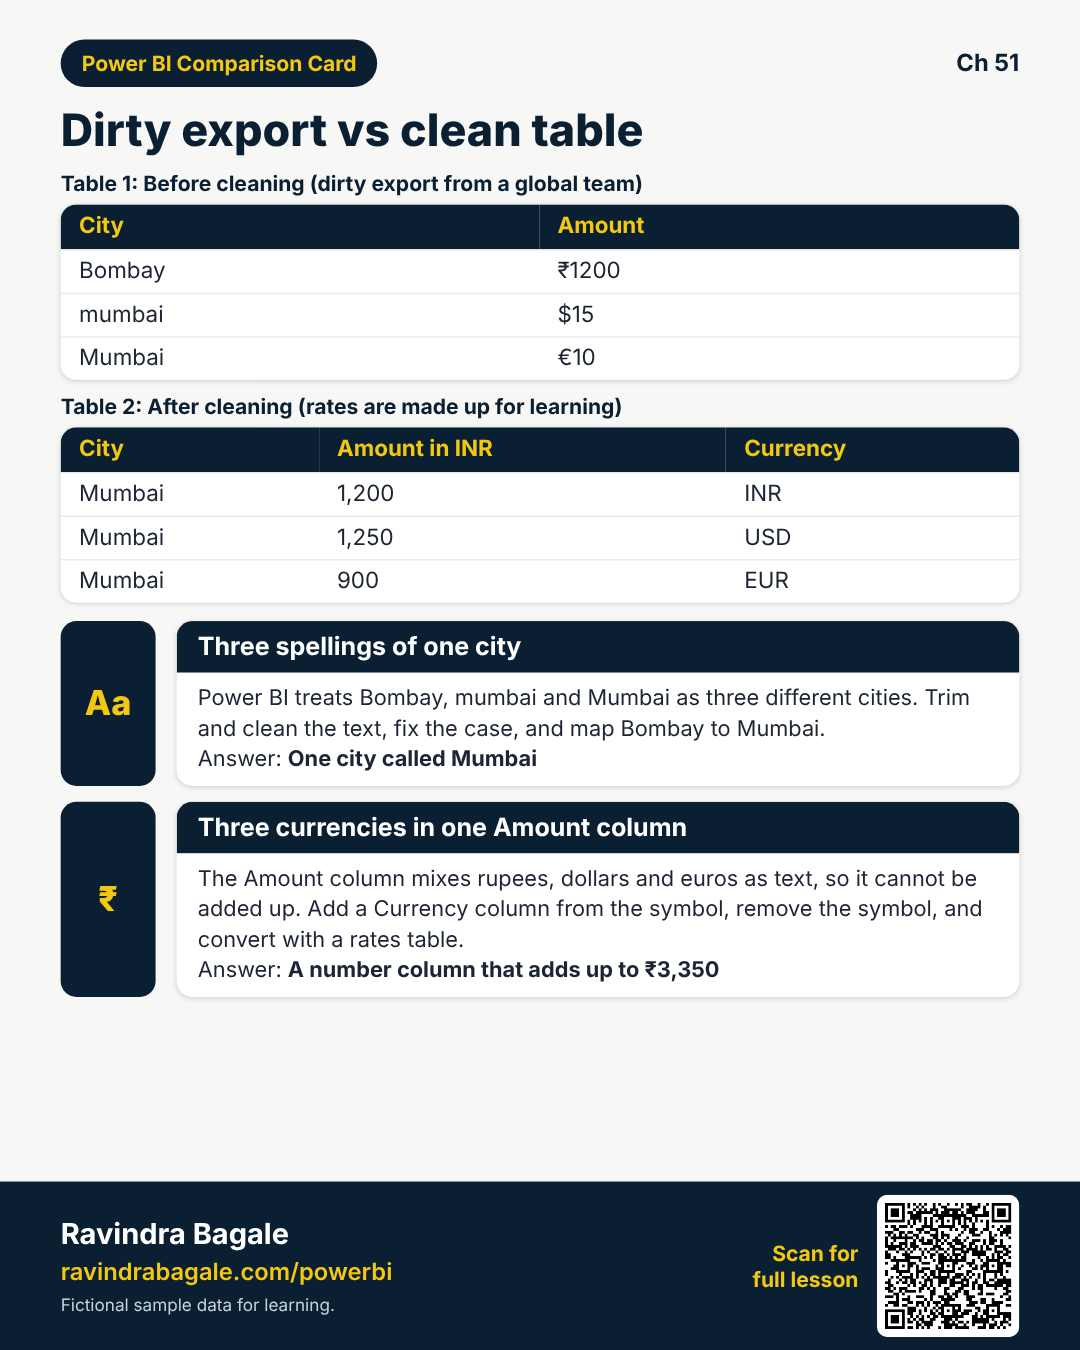
About this data: Fictional multi-currency training set (rates made up).
Why it happens: Global team pastes local currency into one column.
Before (dirty)
| Amount |
|---|
| ₹1200 |
| $15 |
| €10 |
After (clean)
| AmountINR | Currency |
|---|---|
| 1200 | INR |
| 1250 | USD |
| 900 | EUR |
Power Query steps (vertical):
- Detect symbol, then Currency code column
- Strip symbol, then Decimal Amount
- Convert with a rates table (do not hard-code forever)
// detect then strip — rates join in next query
= Table.AddColumn(Source, "Currency", each if Text.Contains([Amount],"₹") then "INR" else if Text.Contains([Amount],"$") then "USD" else "EUR")
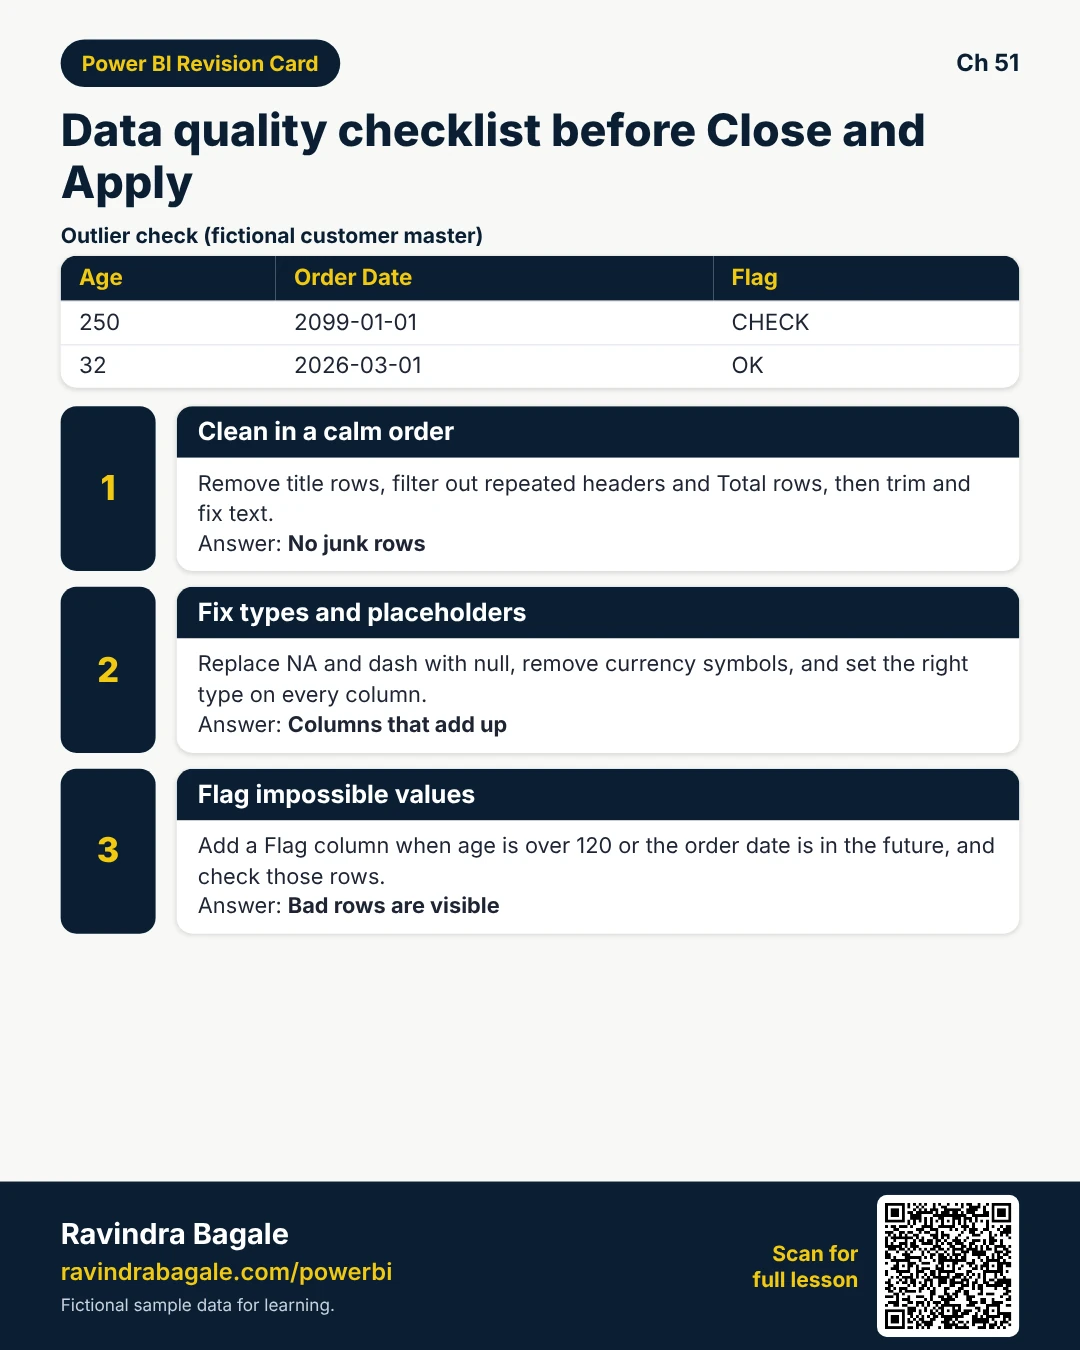
Outliers and impossible values
About this data: Fictional customer master.
Why it happens: Typos (age 250) or wrong century dates.
Before (dirty)
| Age | OrderDate |
|---|---|
| 250 | 2099-01-01 |
| 32 | 2026-03-01 |
After (clean)
| Age | OrderDate | Flag |
|---|---|---|
| 250 | 2099-01-01 | CHECK |
| 32 | 2026-03-01 | OK |
Power Query steps (vertical):
- Add conditional column Flag when Age>120 or OrderDate>Date.From(DateTime.LocalNow())
- Filter Flags to an Errors query for humans
- Do not silently delete without a log
= Table.AddColumn(Source, "Flag", each if [Age]>120 or [OrderDate]>Date.From(DateTime.LocalNow()) then "CHECK" else "OK")Leading zeros lost (PIN, IDs)
About this data: Fictional MH PIN list.
Why it happens: Excel / type detect turns PIN into number, then 001234 becomes 1234.
Before (dirty)
| PIN |
|---|
| 411001 |
| 001234 |
After (clean)
| PIN |
|---|
| 411001 |
| 001234 |
Power Query steps (vertical):
- Set column to Text BEFORE any number transform
- In Excel source, format column as Text or prefix '
- Pad with Text.PadStart if zeros already lost and length is known
= Table.TransformColumns(Source, {{"PIN", each Text.PadStart(Text.From(_), 6, "0"), type text}})Special characters and encoding (Marathi / Hindi / emoji)
About this data: Fictional bilingual order notes — Pune.
Why it happens: CSV saved with wrong encoding turns मराठी into ???. Emojis may break old tools.
Before (dirty)
| Note |
|---|
| पुणे ऑर्डर ✅ |
| Pune order |
After (clean)
| Note |
|---|
| पुणे ऑर्डर ✅ |
| Pune order |
Power Query steps (vertical):
- Get Data — CSV — set File Origin to UTF-8 (65001)
- If already broken, re-export from source as UTF-8
- Keep Text type; do not strip scripts unless policy requires
// UI: CSV dialog, then File Origin = UTF-89. Keys, folders, JSON, PDF junk, time zones, fiscal year, ID typos
Why: Advanced dirt shows up when systems meet.
What: Map categories, find orphan keys, combine folders carefully, expand JSON, strip PDF junk, convert zones, build FY columns, flag bad IDs.
How — handle system dirt:
Vertical steps (one under another)
- Mapping table for categories
- Anti-join orphans
- Folder combine with stable columns
- Expand JSON
- Filter PDF page lines
- UTC, then IST
- Fiscal columns
- Regex/pattern flag typos
Tiny example: Order C9 missing in DimCustomer, then (missing customer); UTC morning, then IST afternoon (fictional).
Ravindra Bagale's Tip
Friends, orphan keys are a model smell. Find them with a left merge before you publish.
Ravindra Bagale's Tip – मराठी
मित्रांनो, orphan keys म्हणजे model वास. Publish आधी left merge ने शोधा.
Ravindra Bagale's Tip – हिंदी
दोस्तों, orphan keys यानी model की गंध। Publish से पहले left merge से खोजें।
Inconsistent codes and categories
About this data: Fictional assortment categories.
Why it happens: Different teams invent their own category spellings.
Before (dirty)
| Category |
|---|
| FMCG |
| fmcg |
| Fast Moving |
| Grocery |
After (clean)
| Category |
|---|
| FMCG |
| FMCG |
| FMCG |
| Grocery |
Power Query steps (vertical):
- Build DimCategory mapping table
- Merge (left join) fact to map
- Expand Canonical category
- Send unmapped rows to Errors
= Table.NestedJoin(Source, {"Category"}, DimMap, {"Alias"}, "j", JoinKind.LeftOuter)Missing keys between tables
About this data: Fictional star schema orphans.
Why it happens: Orders reference CustomerId not in DimCustomer — orphan facts.
Before (dirty)
| OrderId | CustomerId |
|---|---|
| O1 | C9 |
After (clean)
| OrderId | CustomerId | CustomerName |
|---|---|---|
| O1 | C9 | (missing customer) |
Power Query steps (vertical):
- Merge Orders to DimCustomer
- Find null expanded names
- Fix source or add Unknown member
- Relationships need matching keys
= Table.NestedJoin(Orders, {"CustomerId"}, DimCustomer, {"CustomerId"}, "c", JoinKind.LeftOuter)Many files in a folder with different columns
About this data: Fictional monthly folder — Nashik DC.
Why it happens: Each month CSV gained a new column; combine breaks.
Before (dirty)
| Source.Name | City | GMV | Note |
|---|---|---|---|
| jan.csv | Pune | 10 | |
| feb.csv | Pune | 12 | promo |
After (clean)
| City | GMV | Month |
|---|---|---|
| Pune | 10 | jan |
| Pune | 12 | feb |
Power Query steps (vertical):
- Get Data — Folder — Combine
- Use a sample file with the stable columns only
- Remove extra columns after combine
- Or append queries that each select the common set
// Folder combine then
= Table.SelectColumns(Combined, {"City","GMV","Source.Name"})
JSON / nested data
About this data: Fictional API extract.
Why it happens: API returns nested JSON; one cell holds a record.
Before (dirty)
| payload |
|---|
| {"city":"Pune","gmv":10} |
After (clean)
| city | gmv |
|---|---|
| Pune | 10 |
Power Query steps (vertical):
- Convert JSON to table
- Expand record/list columns
- Set types on expanded fields
= Table.ExpandRecordColumn(Table.TransformColumns(Source, {{"payload", Json.Document}}), "payload", {"city","gmv"})PDF / web table junk
About this data: Fictional PDF scrape.
Why it happens: PDF/web scrape brings page footers and title lines.
Before (dirty)
| Col1 |
|---|
| Page 1 of 5 |
| City GMV |
| Pune 10 |
After (clean)
| City | GMV |
|---|---|
| Pune | 10 |
Power Query steps (vertical):
- Remove rows matching Page * of *
- Promote real header
- Split City/GMV if stuck together
- Prefer a proper CSV from the owner when possible
= Table.SelectRows(Source, each not Text.StartsWith([Col1], "Page "))Time zones
About this data: Fictional event log.
Why it happens: Server stores UTC; business in Asia/Calcutta (UTC+05:30).
Before (dirty)
| EventUtc |
|---|
| 2026-03-04T09:00:00Z |
After (clean)
| EventIst |
|---|
| 2026-03-04 14:30:00 |
Power Query steps (vertical):
- Keep UTC column
- Add IST = DateTimeZone.SwitchZone or +#duration(0,5,30,0)
- Never mix zones in one column without labels
= Table.AddColumn(Source, "EventIst", each DateTimeZone.RemoveZone(DateTimeZone.SwitchZone([EventUtc], 5.5)))Fiscal year vs calendar year
About this data: Fictional Indian FY.
Why it happens: Indian companies often start fiscal year in April.
Before (dirty)
| Date |
|---|
| 2026-04-01 |
After (clean)
| Date | FiscalYear |
|---|---|
| 2026-04-01 | FY26-27 |
Power Query steps (vertical):
- Mark Date table
- Add FiscalYear = if Month>=4 then Year else Year-1 (pattern)
- Use fiscal columns in visuals when finance asks FY
= Table.AddColumn(Date, "FiscalYear", each if Date.Month([Date])>=4 then "FY" & Text.End(Text.From(Date.Year([Date])),2) & "-" & Text.End(Text.From(Date.Year([Date])+1),2) else "FY" & Text.End(Text.From(Date.Year([Date])-1),2) & "-" & Text.End(Text.From(Date.Year([Date])),2))Typos in IDs
About this data: Fictional order ids.
Why it happens: Letter l vs digit 1; repeated paste.
Before (dirty)
| OrderId |
|---|
| ORD-1001 |
| ORD-100l |
| ORD-1001 |
After (clean)
| OrderId | Flag |
|---|---|
| ORD-1001 | OK |
| ORD-100l | TYPO? |
| ORD-1001 | DUP |
Power Query steps (vertical):
- Validate with a pattern (starts with ORD-, digits)
- Flag non-matching
- Distinct on clean IDs
- Fix at source when possible
= Table.AddColumn(Source, "Flag", each if Text.Length([OrderId])<>8 then "TYPO?" else "OK")10. How dirty can data be? — end-to-end cleanup
Why: Mess stacks. Students need one full walk-through.
What: See the worked showcase below the tip — dirty excerpt, then clean fact, then M sketch.
How — follow the order in the showcase:
Vertical steps (one under another)
- Open the downloadable messy file in practice assets.
- Repeat the 11 vertical steps from the showcase.
- Compare your FactSales_Clean to the clean sample CSV.
- Write three rows you sent to Errors and why.
Tiny example: Duplicate ORD-1001 removed; ORD-100l flagged TYPO_ID; $15 future date sent to Errors (fictional).
Ravindra Bagale's Tip
Friends, how dirty can data be? Very. Your job is a calm checklist, not panic.
Ravindra Bagale's Tip – मराठी
मित्रांनो, data किती गलिच्छ असू शकतो? खूप. घाबरणे नाही — शांत checklist.
Ravindra Bagale's Tip – हिंदी
दोस्तों, डेटा कितना गंदा हो सकता है? बहुत। घबराहट नहीं — शांत checklist।
Why: Real files stack many problems in one sheet. You need a calm order of steps.
What: One fictional Pune Kirana Weekly export that is badly messy. We clean it top to bottom.
How — clean in this order:
- Remove title / page junk rows; promote real headers.
- Filter out mid-file header repeats and Total rows.
- Trim + Clean text columns; fix Bombay, then Mumbai; Title case cities.
- Replace NA/- placeholders with null.
- Strip ₹ and commas; brackets, then negative; type Decimal for GMV.
- Parse dates with English (India) locale; convert Excel serials.
- Set PIN / OrderId as Text; pad PIN to 6.
- Unpivot month columns if present; split tag lists.
- Flag outliers (GMV < 0 extreme, future dates) into Errors query.
- Left-merge to DimCustomer; label orphan keys.
- Name the final query FactSales_Clean; Close & Apply.
About this data: Fictional Pune kirana weekly export for learning. Brands and numbers are made up.
| A | B | C | D | E |
|---|---|---|---|---|
| Pune Kirana Weekly — CONFIDENTIAL | ||||
| OrderId | City | PIN | GMV | OrderDate |
| ORD-1001 | mumbai | 400001 | ₹1,200 | 03/04/2026 |
| ORD-1001 | Bombay | 400001 | ₹1,200 | 03/04/2026 |
| ORD-100l | PUNE | 411001 | (900) | 45321 |
| ORD-1003 | Nashik | NA | 2,500 | 04-Apr-2026 |
| Total | 4,000 | |||
| OrderId | City | PIN | GMV | OrderDate |
| ORD-1004 | पुणे | 001234 | $15 | 2099-01-01 |
| OrderId | City | PIN | GMV_INR | OrderDate | Flag |
|---|---|---|---|---|---|
| ORD-1001 | Mumbai | 400001 | 1200 | 2026-04-03 | OK |
| ORD-1003 | Nashik | (missing) | 2500 | 2026-04-04 | OK |
| ORD-100l | Pune | 411001 | -900 | 2024-01-30 | TYPO_ID |
| ORD-1004 | Pune | 001234 | CURRENCY+FUTURE — to Errors |
// Sketch of the cleanup chain (fictional training query names)
let
  Source = Excel.Workbook(File.Contents("PuneKirana_Messy.xlsx"), true),
  Sheet = Source{[Item="Sheet1",Kind="Sheet"]}[Data],
  SkipTitle = Table.Skip(Sheet, 1),
  Headers = Table.PromoteHeaders(SkipTitle, [PromoteAllScalars=true]),
  NoHeaderRepeats = Table.SelectRows(Headers, each [OrderId] <> "OrderId" and [OrderId] <> "Total"),
  TrimCity = Table.TransformColumns(NoHeaderRepeats, {{"City", Text.Trim}}),
  FixAlias = Table.ReplaceValue(TrimCity, "Bombay", "Mumbai", Replacer.ReplaceText, {"City"}),
  // ... continue: duplicates, types, locale dates, flags, merge
  Result = FixAlias
in
  Result
11. Column profiling and a data quality checklist
Why: You cannot clean what you do not see. Profiling shows errors, empty, and distinct counts before you model.
What: In Power Query: View — Column quality, Column distribution, Column profile. Quality = % valid / error / empty. Distribution = distinct / unique. Profile = stats for the selected column (first 1000 rows by default — change to entire data set when needed).
How — profile then checklist:
Vertical steps (one under another)
- View — tick Column quality, distribution, profile.
- Profiling may use first 1000 rows — switch to entire data set for final checks.
- Sort columns with highest error % or empty % first.
- Run the checklist below before Close & Apply.
- Keep an Errors query for rows that need a human.
Tiny example: GMV column quality shows 4% error after Decimal cast, then those rows still have ₹ symbols (fictional).
Ravindra Bagale's Tip
Friends, turn on Column quality on every new file. Two minutes now saves two hours later.
Ravindra Bagale's Tip – मराठी
मित्रांनो, प्रत्येक नवीन file वर Column quality चालू करा. दोन मिनिटे = दोन तास वाचतात.
Ravindra Bagale's Tip – हिंदी
दोस्तों, हर नई file पर Column quality चालू करें। दो मिनट = दो घंटे बचाते हैं।
Data quality checklist (print me)
- Headers are one clean row (no merged titles).
- No Total / Subtotal rows in facts.
- No mid-file repeated headers.
- Text trimmed and cleaned; aliases mapped.
- Placeholders (NA/-) handled on purpose.
- Types set with correct locale.
- IDs / PIN kept as Text with leading zeros.
- Dates parsed; fiscal columns added if needed.
- Units and currencies normalised.
- Outliers flagged; Errors query saved.
- Keys match dimensions (no silent orphans).
- Column quality reviewed on entire data set.
- Query names clear: FactSales_Clean, DimCity, Errors_Sales.
- About this data note written for the next human.
Download practice files: PuneKirana_Messy.csv · PuneKirana_Messy.xlsx · PuneKirana_Clean_Sample.csv (fictional learning data).
Quiz (5 questions)
1. PIN codes and employee IDs should usually be which type?
2. 03/04/2026 with English (India) locale is usually:
3. Excel serial 45321 in a column most likely needs:
4. Months across columns (Jan, Feb, …) should become a tall table using:
5. Column quality in Power Query mainly shows:
Practice tasks (12) — hints only, no full answers
- Task. List 8 Power Query data types and one use each.
Hint: section 2 table. - Task. Explain why 03/04 is dangerous without locale.
Hint: section 3. - Task. Clean a City column with Trim, Clean, Bombay, then Mumbai.
Hint: section 5. - Task. Turn ₹1,200 and (900) into decimal numbers.
Hint: sections 6 and 8. - Task. Remove Total rows and repeated headers from a stacked sheet.
Hint: section 7. - Task. Unpivot Jan/Feb columns into Month + GMV.
Hint: section 7 unpivot. - Task. Keep PIN 001234 as Text with 6 digits.
Hint: section 8 leading zeros. - Task. Flag age 250 and date 2099 as CHECK.
Hint: section 8 outliers. - Task. Find orphan CustomerId with a left merge.
Hint: section 9. - Task. Convert a UTC timestamp to IST (+05:30).
Hint: section 9 time zones. - Task. Open PuneKirana_Messy and produce FactSales_Clean matching the sample.
Hint: section 10 showcase + assets. - Task. Turn on Column quality/distribution/profile and fill the checklist.
Hint: section 11. - Task. Write M or UI steps to split Tags by semicolon.
Hint: section 7 split. - Task. Interview answer: RLS vs dirty data — which do you fix first and why?
Hint: clean data before security theatre.
Ravi Sir's cards (Excel card style)
Standalone cards — no tip or photo sections. QR points to this lesson. Download PNG to revise offline.
Think like a professional
In a real tenant, rights and sharing are controlled by Fabric / Power BI admins. Always follow your company policy. This lesson uses fictional people and numbers so you can practise the ideas safely.