49.1 Performance Analyzer and Model Tuning
Chala mitrano — find the slow visual, fix the DAX or the model, prove it got faster. Stop guessing.
चला मित्रांनो — मंद visual शोधा, DAX किंवा model दुरुस्त करा, वेग वाढल्याचे सिद्ध करा. अंदाज थांबवा.
चला मित्रों — धीमा visual खोजें, DAX या model ठीक करें, तेज़ी सिद्ध करें। अंदाज़ बंद करें।
- Run Performance Analyzer and read DAX vs visual time.
- Describe DAX Studio / VertiPaq Analyzer at overview level.
- Reduce cardinality and remove useless columns.
- Avoid bi-directional relationship traps.
- Explain when aggregation tables help.
- Apply report-design performance tips.
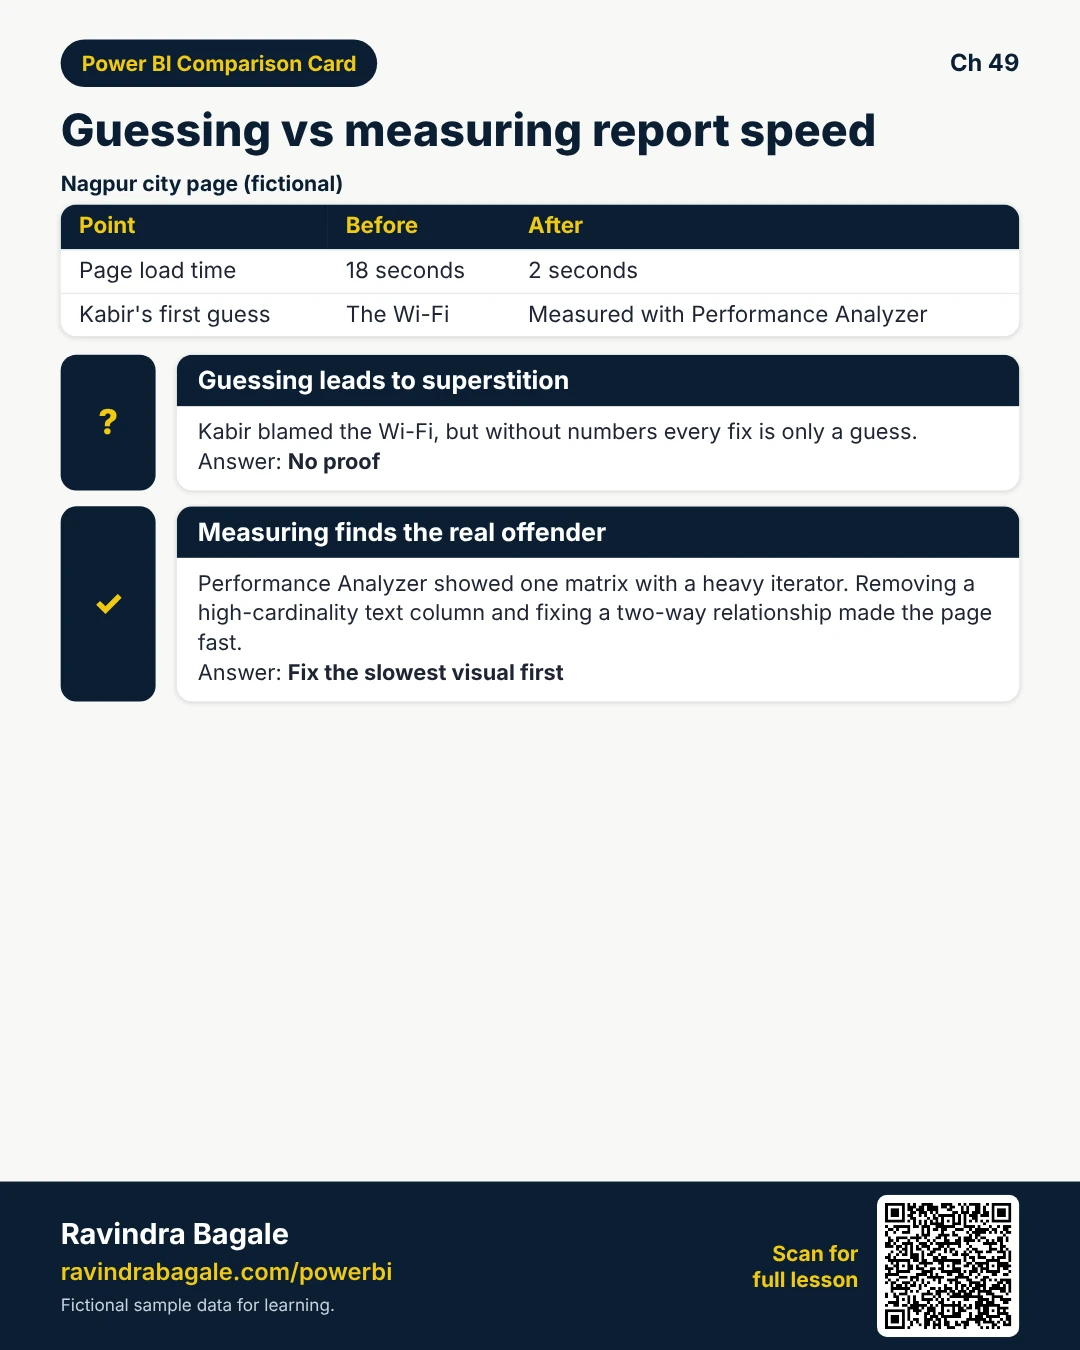
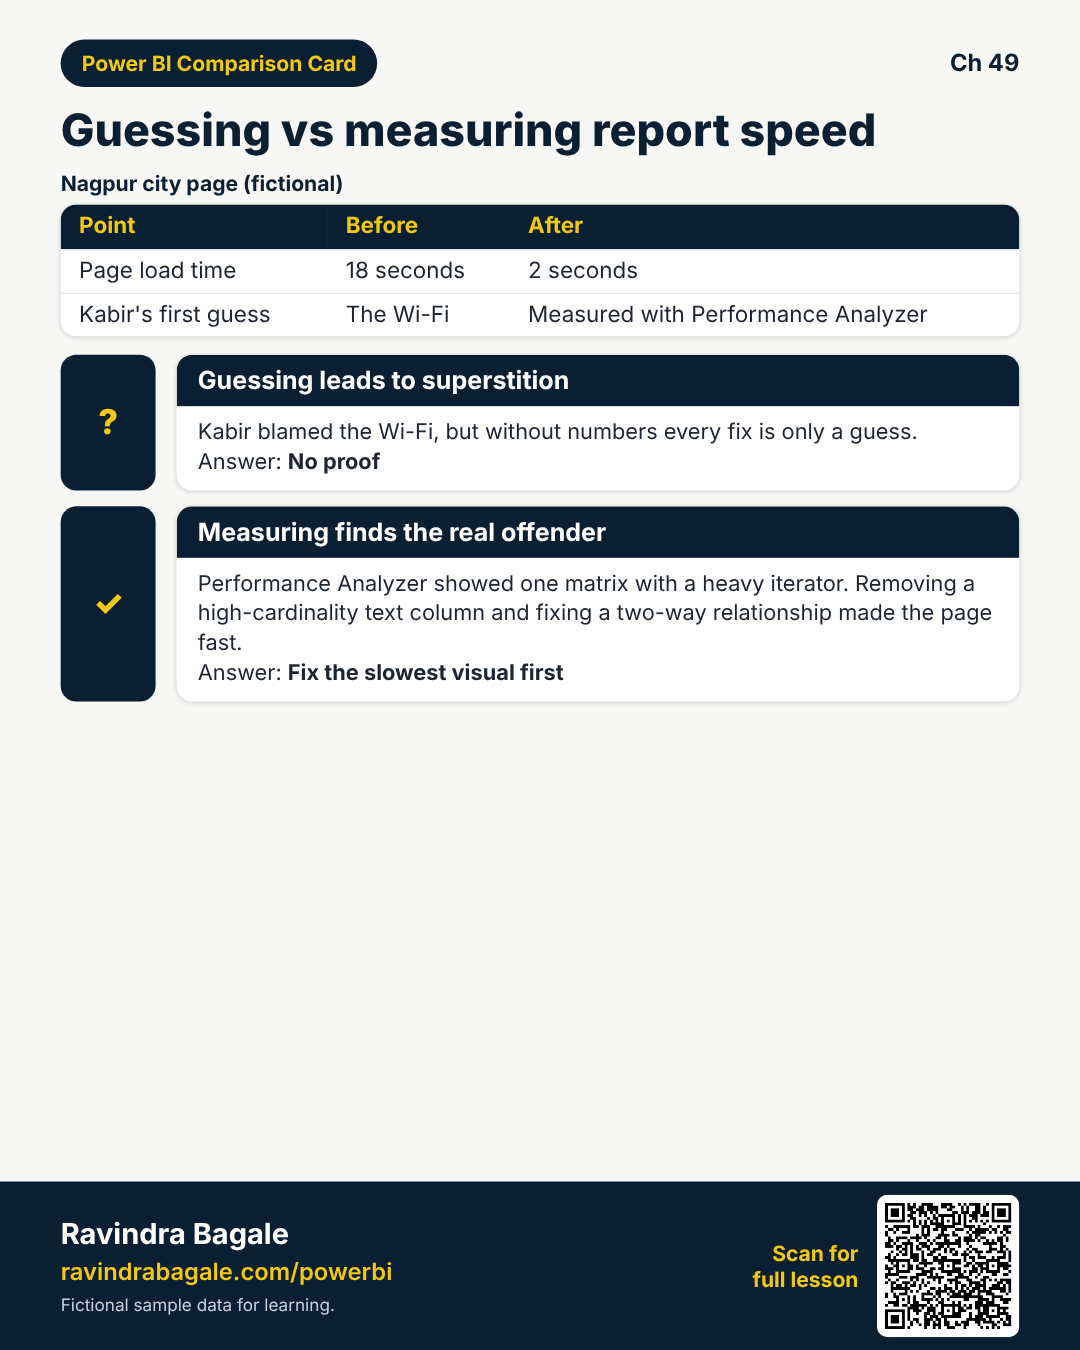
Start with a problem (fictional). Nagpur city page took 18 seconds. Kabir blamed Wi-Fi. Performance Analyzer showed one matrix with a heavy iterator. After removing a high-cardinality text column and fixing a bi-di relationship, the page hit 2 seconds — and he saved before/after screenshots for Training.
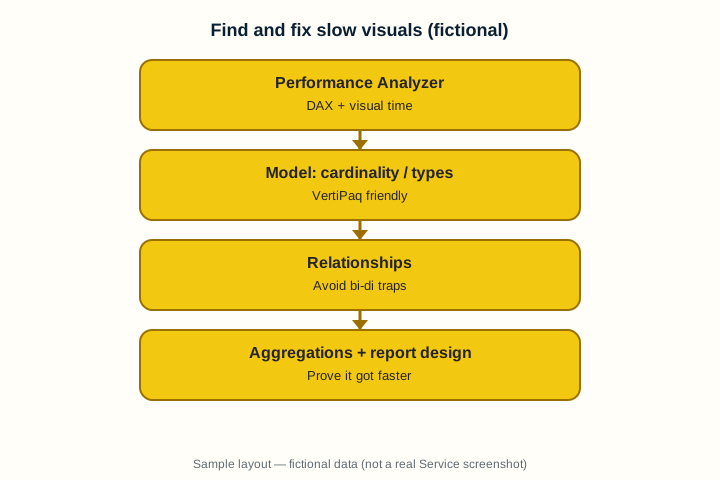
1. Performance Analyzer pane
Why: Without numbers, every fix is superstition.
What: Performance Analyzer records visual display time, DAX query time, and other durations per visual.
How — measure first:
Vertical steps (one under another)
- View → Performance Analyzer → Start recording.
- Refresh visuals / interact once.
- Stop; sort by longest DAX or total.
- Copy query for DAX Studio if needed.
- Save a screenshot before changes.
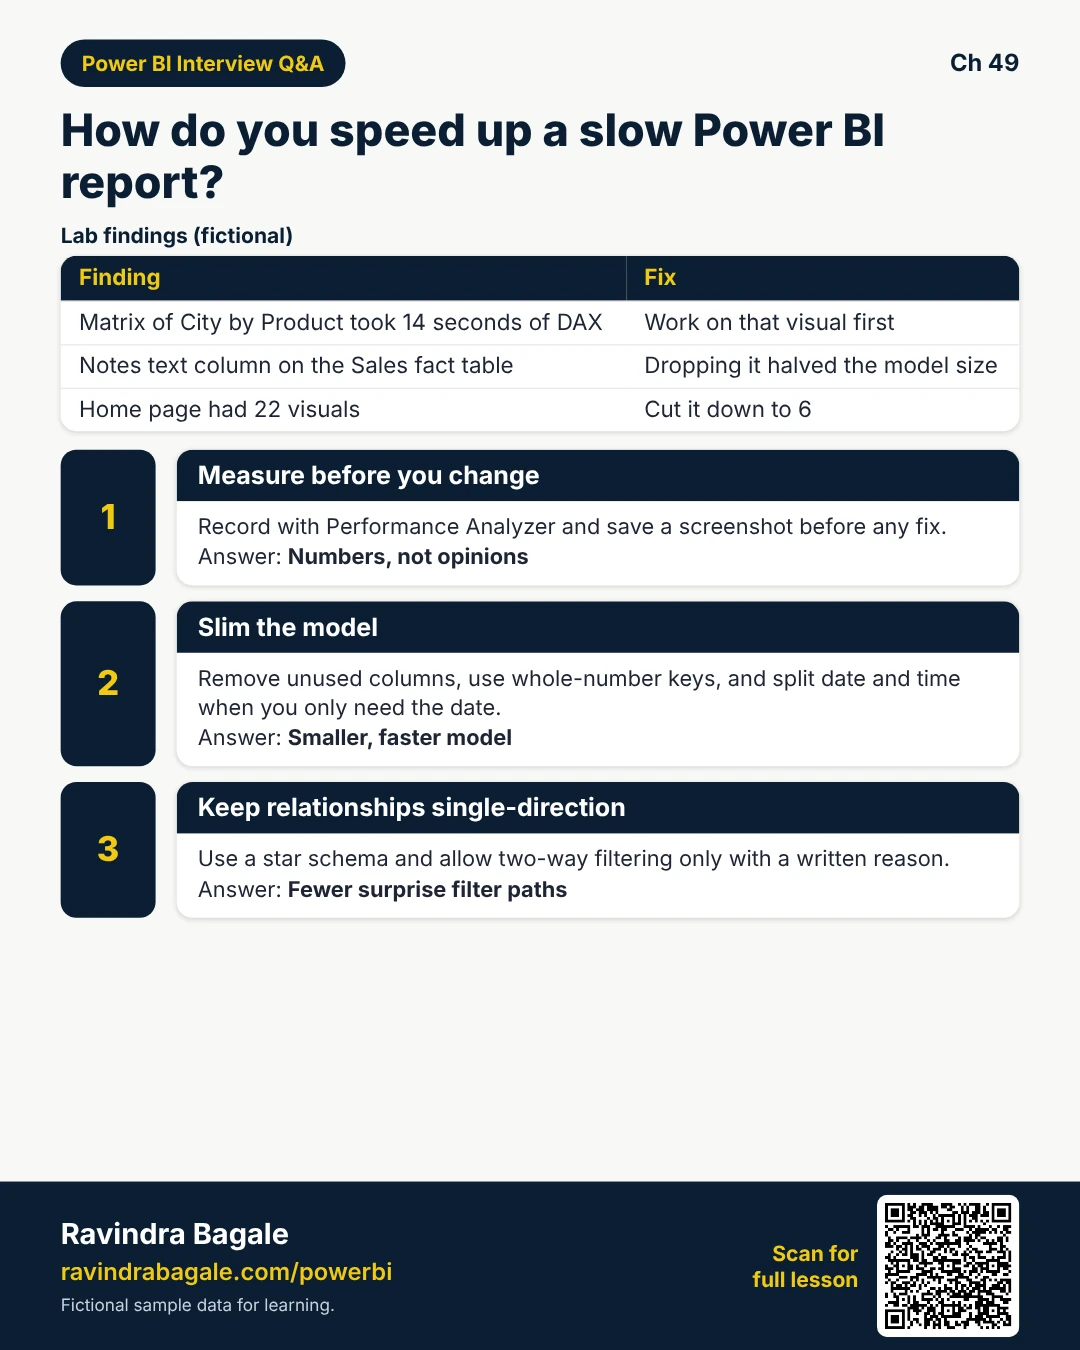
Tiny example: Matrix City x Product = 14s DAX (fictional) — target that visual first.
Ravindra Bagale's Tip
Friends, fix the top offender first — not the prettiest visual.
Ravindra Bagale's Tip – मराठी
मित्रांनो, सर्वात मंद आधी दुरुस्त — सर्वात सुंदर नाही.
Ravindra Bagale's Tip – हिंदी
दोस्तों, सबसे धीमा पहले ठीक — सबसे सुंदर नहीं।
2. DAX Studio / VertiPaq Analyzer overview
Why: Some problems live in storage engine and columns, not one measure line.
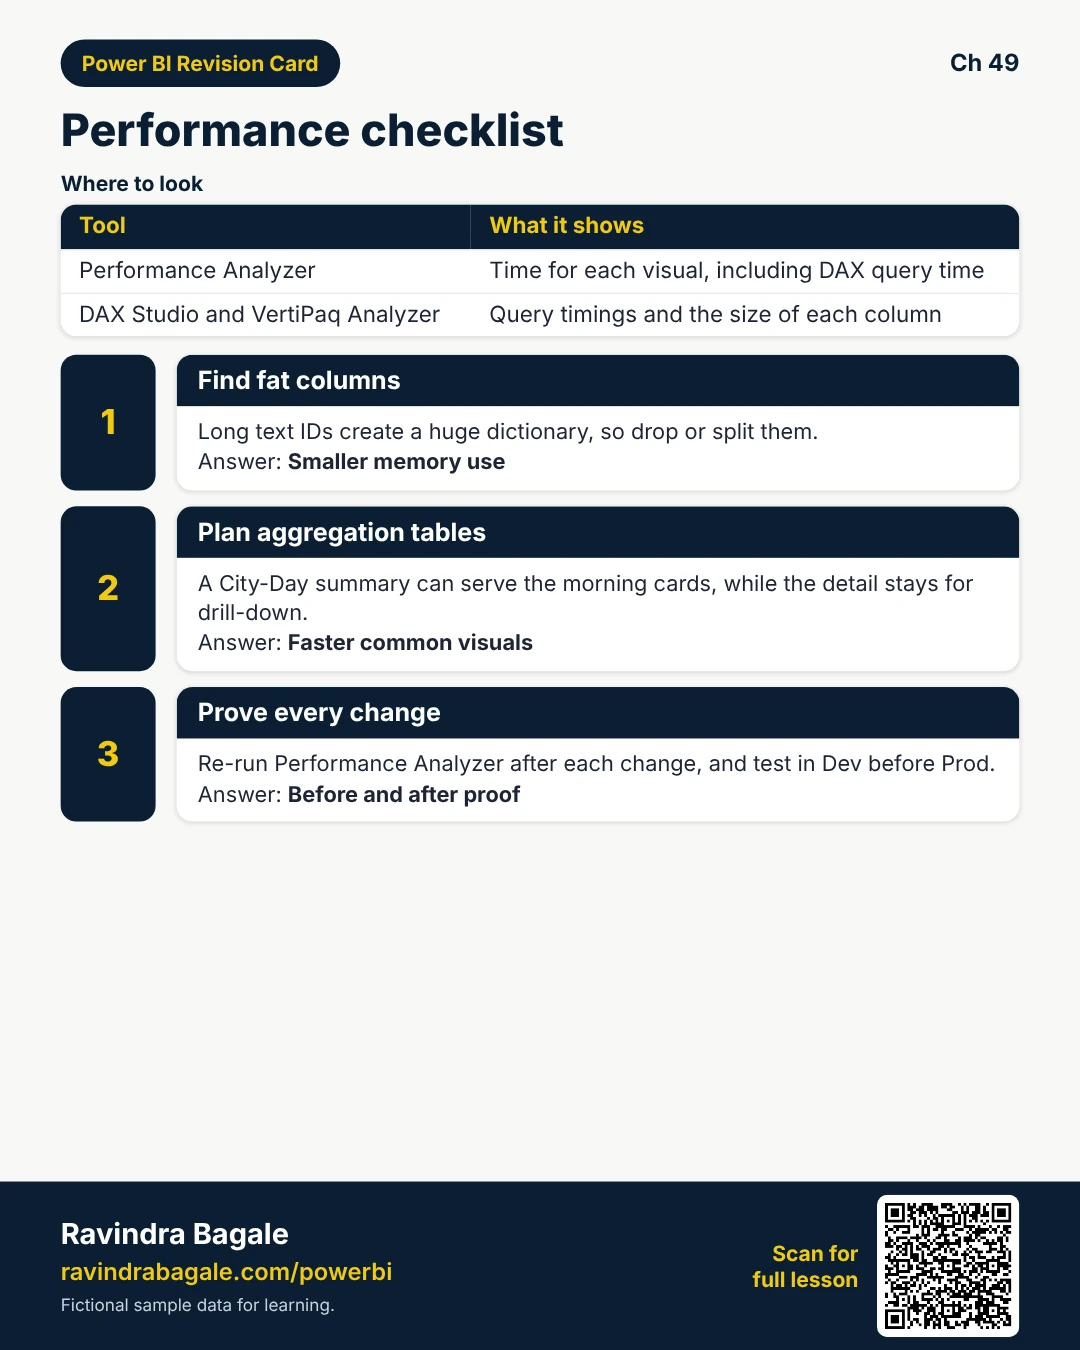
What: DAX Studio and VertiPaq Analyzer (overview) show query plans, timings, and column sizes — learn where Training installs them.
How — use as a map:
Vertical steps (one under another)
- Paste the Analyzer query into DAX Studio when available.
- Look at storage engine vs formula engine time (high level).
- VertiPaq: find fat columns (long text IDs).
- Prioritise dropping or splitting fat columns.
- Do not change Prod without Dev proof.
Tiny example: Long GUID text column = huge dictionary (fictional finding).
Ravindra Bagale's Tip
Friends, tools name-drop less than screenshots of before/after ms.
Ravindra Bagale's Tip – मराठी
मित्रांनो, tools पेक्षा before/after ms screenshots भारी.
Ravindra Bagale's Tip – हिंदी
दोस्तों, tools से before/after ms screenshots बेहतर।
3. Cardinality, data types, columns to remove
Why: High cardinality columns hurt compression and slicers.
What: Prefer integers keys, short categories, kill unused columns, avoid precise datetimes when date is enough.
How — slim the model:
Vertical steps (one under another)
- Remove columns not used in reports/relationships.
- Replace text keys with integers where possible.
- Split DateTime into Date + Time if needed.
- Watch distinct counts on fact tables.
- Re-run Analyzer after changes.
Tiny example: Dropping Notes text from Sales fact halved size in lab (fictional).
Ravindra Bagale's Tip
Friends, every unused column is tax on refresh and memory.
Ravindra Bagale's Tip – मराठी
मित्रांनो, न वापरलेला column refresh/memory कर आहे.
Ravindra Bagale's Tip – हिंदी
दोस्तों, बिना इस्तेमाल column refresh/memory टैक्स है।
4. Relationship and bi-directional traps
Why: Bi-directional filters feel helpful until ambiguity and slow scans appear.
What: Prefer single-direction star schema; use bi-di sparingly with a documented reason.
How — check relationships:
Vertical steps (one under another)
- Draw the star: facts many-to-one to dimensions.
- Hunt active bi-di relationships.
- Replace with CROSSFILTER in CALCULATE when rare needs arise.
- Resolve ambiguity with clear bridge tables.
- Retest RLS after relationship changes.
Tiny example: Bi-di between City and Sales forced unexpected filter paths — flipped to single (fictional).
Ravindra Bagale's Tip
Friends, bi-di is a spice — a pinch, not a cup.
Ravindra Bagale's Tip – मराठी
मित्रांनो, bi-di मसाला आहे — चिमूट, वाटी नाही.
Ravindra Bagale's Tip – हिंदी
दोस्तों, bi-di मसाला है — चुटकी, कटोरी नहीं।
5. Aggregation tables
Why: Huge facts make every visual scan too much detail.
What: Aggregation tables store summarised grains; the engine may hit them instead of detail (Import/composite patterns).
How — know when to plan them:
Vertical steps (one under another)
- Identify common grains (City-Day).
- Build agg table in ETL or model.
- Manage aggregations so hits occur.
- Prove hit/miss with tools/Training guidance.
- Keep detail for drill when needed.
Tiny example: City-Day agg serves morning cards; detail for invoice drill (concept).
Ravindra Bagale's Tip
Friends, aggs are architecture — not a one-click paint job.
Ravindra Bagale's Tip – मराठी
मित्रांनो, aggregations architecture आहे — एक-क्लिक रंग नाही.
Ravindra Bagale's Tip – हिंदी
दोस्तों, aggregations architecture है — एक-क्लिक रंग नहीं।
6. Report-design performance tips
Why: Too many visuals on one page punish every open.
What: Fewer visuals, less cross-highlighting chaos, avoid heavy charts on landing pages.
How — design light pages:
Vertical steps (one under another)
- Limit visuals on the home page.
- Prefer cards + one chart; drill to detail pages.
- Reduce unnecessary interactions.
- Avoid huge tables on first view.
- Measure again after UI cleanup.
Tiny example: Home page 6 visuals instead of 22 — open time drops (fictional).
Ravindra Bagale's Tip
Friends, prove speed with Analyzer numbers in the Training demo — stories stick.
Ravindra Bagale's Tip – मराठी
मित्रांनो, Training मध्ये Analyzer संख्या दाखवा — गोष्ट चिकटते.
Ravindra Bagale's Tip – हिंदी
दोस्तों, Training में Analyzer संख्या दिखाएं — कहानी चिपकती है।
Quiz (5 questions)
1. Performance Analyzer helps you:
2. High cardinality columns often:
3. Bi-directional relationships:
4. Aggregation tables aim to:
5. Report design tip:
Practice tasks (12) — hints only, no full answers
- Task. List steps to record with Performance Analyzer.
Hint: section 1. - Task. What do you save before changing the model?
Hint: screenshot ms. - Task. Name two VertiPaq smells (fat columns).
Hint: section 2-3. - Task. Why prefer integer keys?
Hint: cardinality. - Task. Star schema arrow direction in one line.
Hint: section 4. - Task. When CROSSFILTER instead of permanent bi-di?
Hint: rare need. - Task. City-Day agg vs invoice detail — who uses which?
Hint: section 5. - Task. Cut a 22-visual home page — proposal.
Hint: section 6. - Task. Kabir 18s to 2s — name two fixes from story.
Hint: story. - Task. Does Wi-Fi blame replace Analyzer? Why not?
Hint: measure first. - Task. RLS retest after relationship change — why?
Hint: section 4. - Task. Interview: how do you prove a fix worked?
Hint: before/after.
Ravi Sir's cards (Excel card style)
Standalone cards — no tip or photo sections. QR points to this lesson. Download PNG to revise offline.
Think like a professional
In a real tenant, rights and sharing are controlled by Fabric / Power BI admins. Always follow your company policy. This lesson uses fictional people and numbers so you can practise the ideas safely.