48.1 Calculation Groups and Field Parameters
Chala mitrano — one visual, many measures or time views, without copy-paste measures. Field parameters, what-if, and calculation groups.
चला मित्रांनो — एक visual, अनेक measures किंवा time views, copy-paste शिवाय. Field parameters, what-if आणि calculation groups.
चला मित्रों — एक visual, कई measures या time views, copy-paste के बिना। Field parameters, what-if और calculation groups।
- Build a field parameter for measures or dimensions.
- Add a what-if parameter for scenarios.
- Explain calculation groups at overview level.
- Describe time-intel calc items pattern.
- Choose field parameter vs calculation group.
- Sketch dynamic Top N with a parameter.
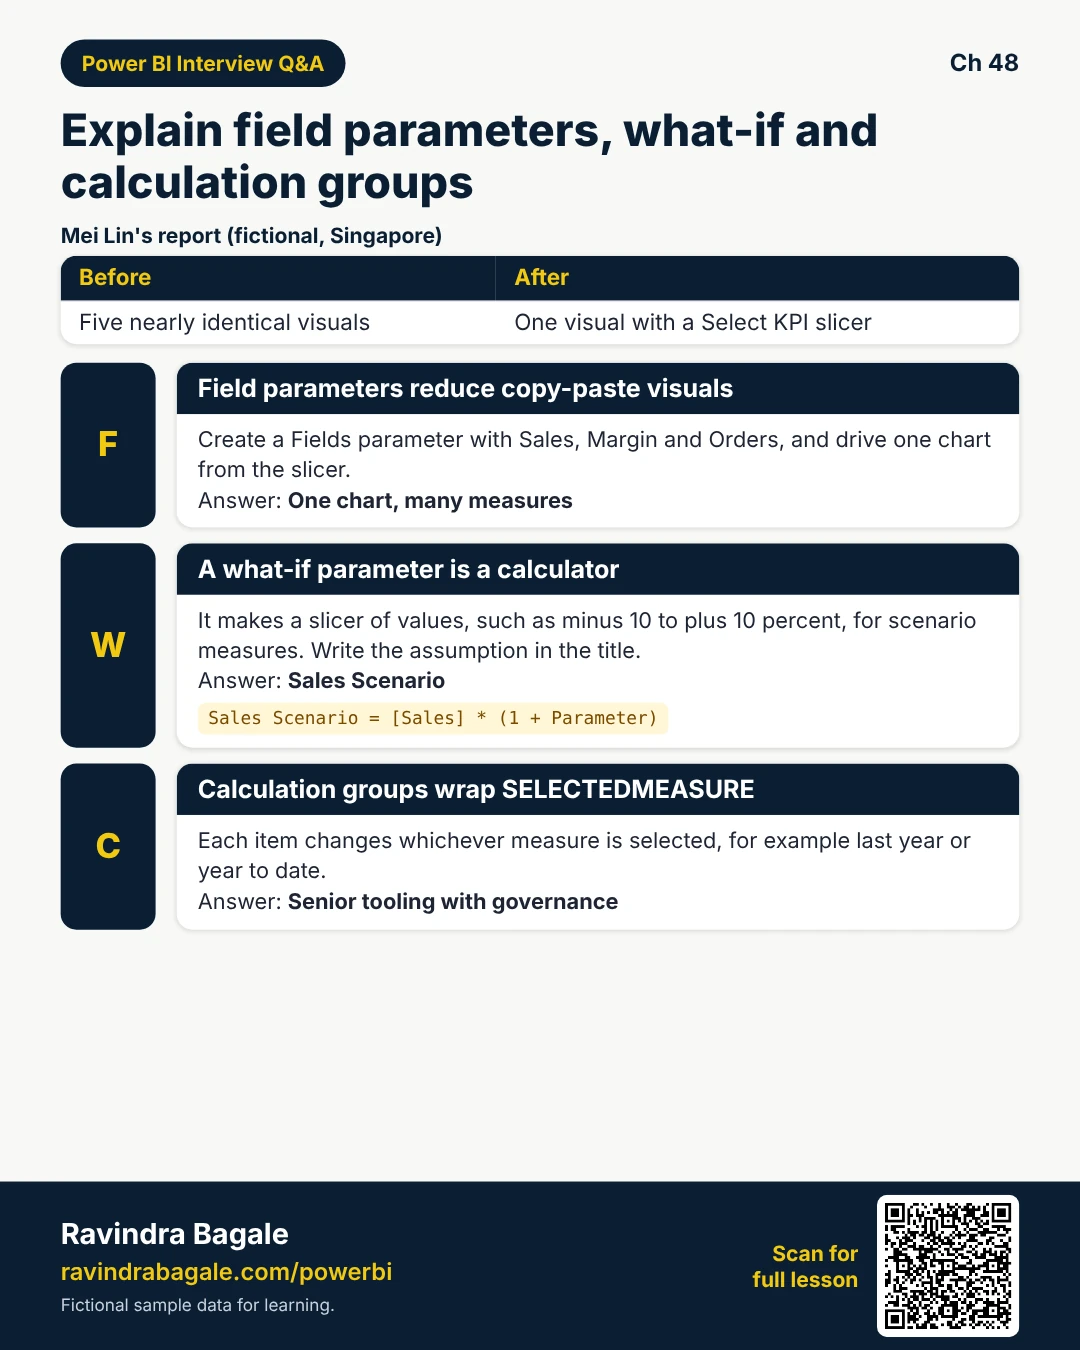
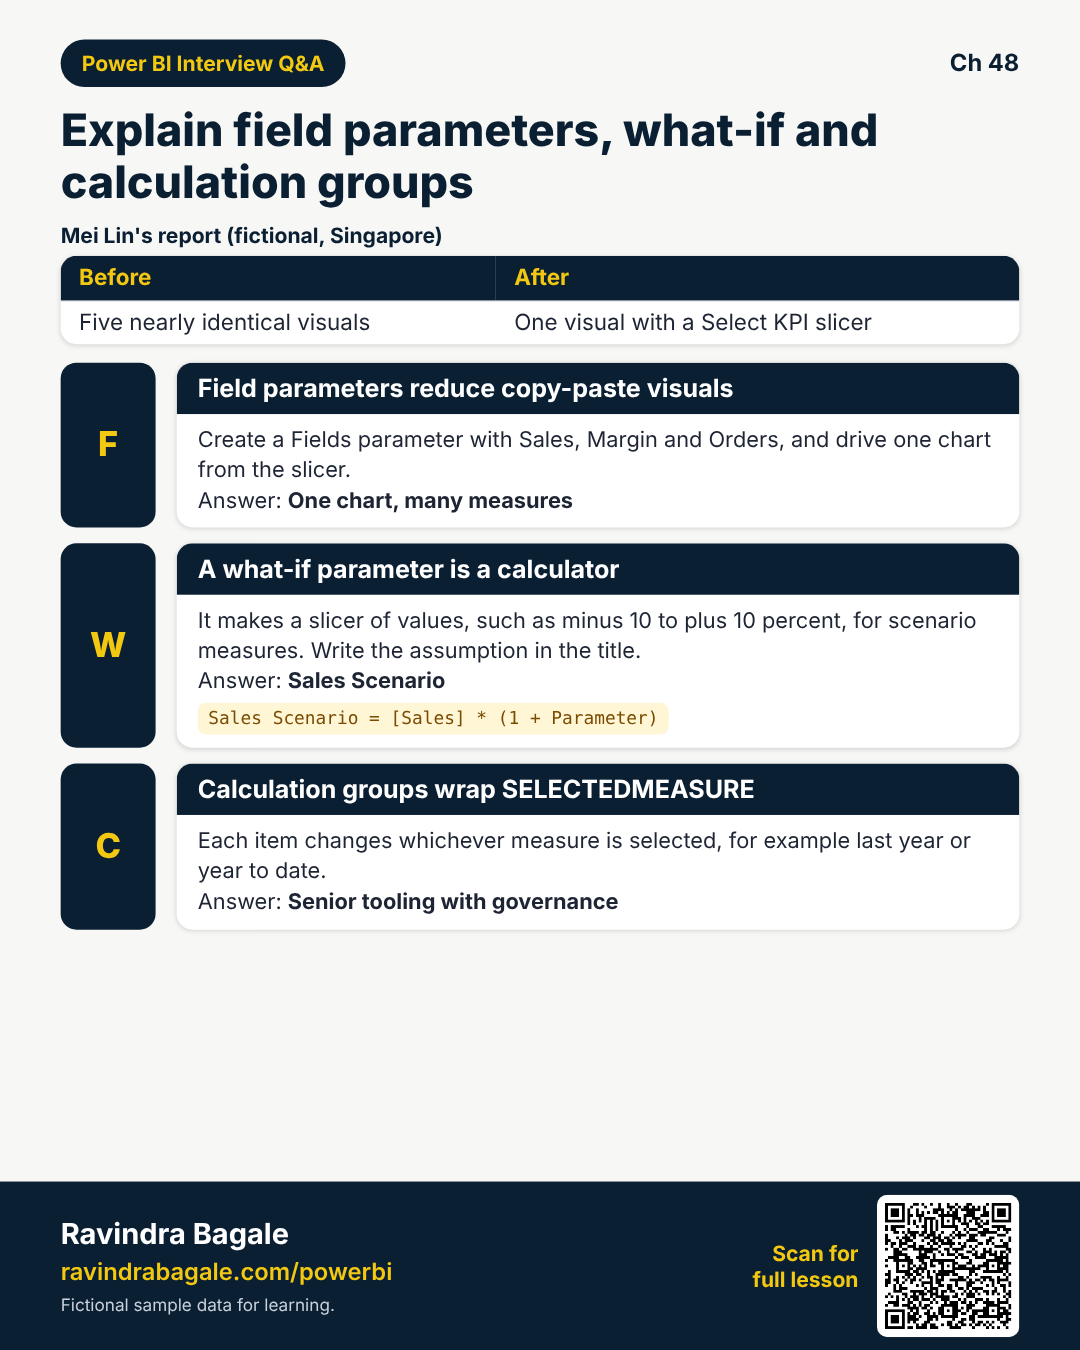
Start with a problem (fictional). Mei Lin (Singapore, fictional) maintained Sales, Sales LY, Sales YTD, Margin, Margin LY as five nearly identical visuals. Field parameters collapsed measure choice. Later, Tabular Editor calculation groups taught time views on one base measure — Training warned: learn governance before 50 calc items.
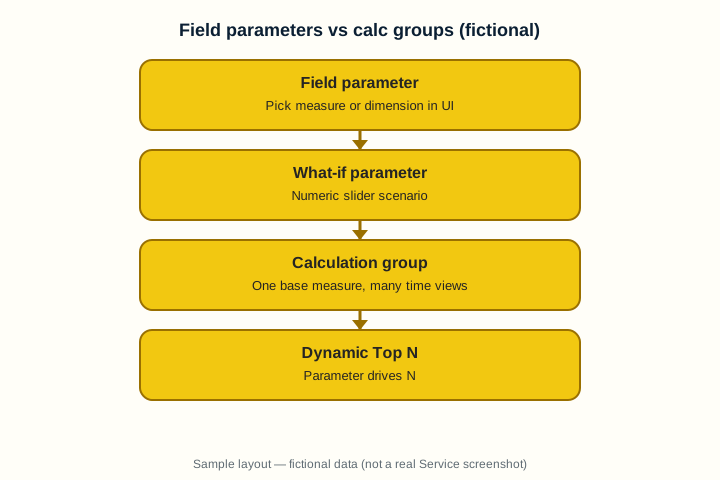
1. Field parameters (measures and dimensions)
Why: Copy-paste visuals for every measure waste hours.
What: A field parameter lets the report user pick which fields (measures or dimensions) feed a visual.
How — create one:
Vertical steps (one under another)
- Modeling, then New parameter, then Fields.
- Add [Sales], [Margin], [Orders] (fictional).
- Put the parameter slicer on the page.
- Drive the visual values from the parameter field.
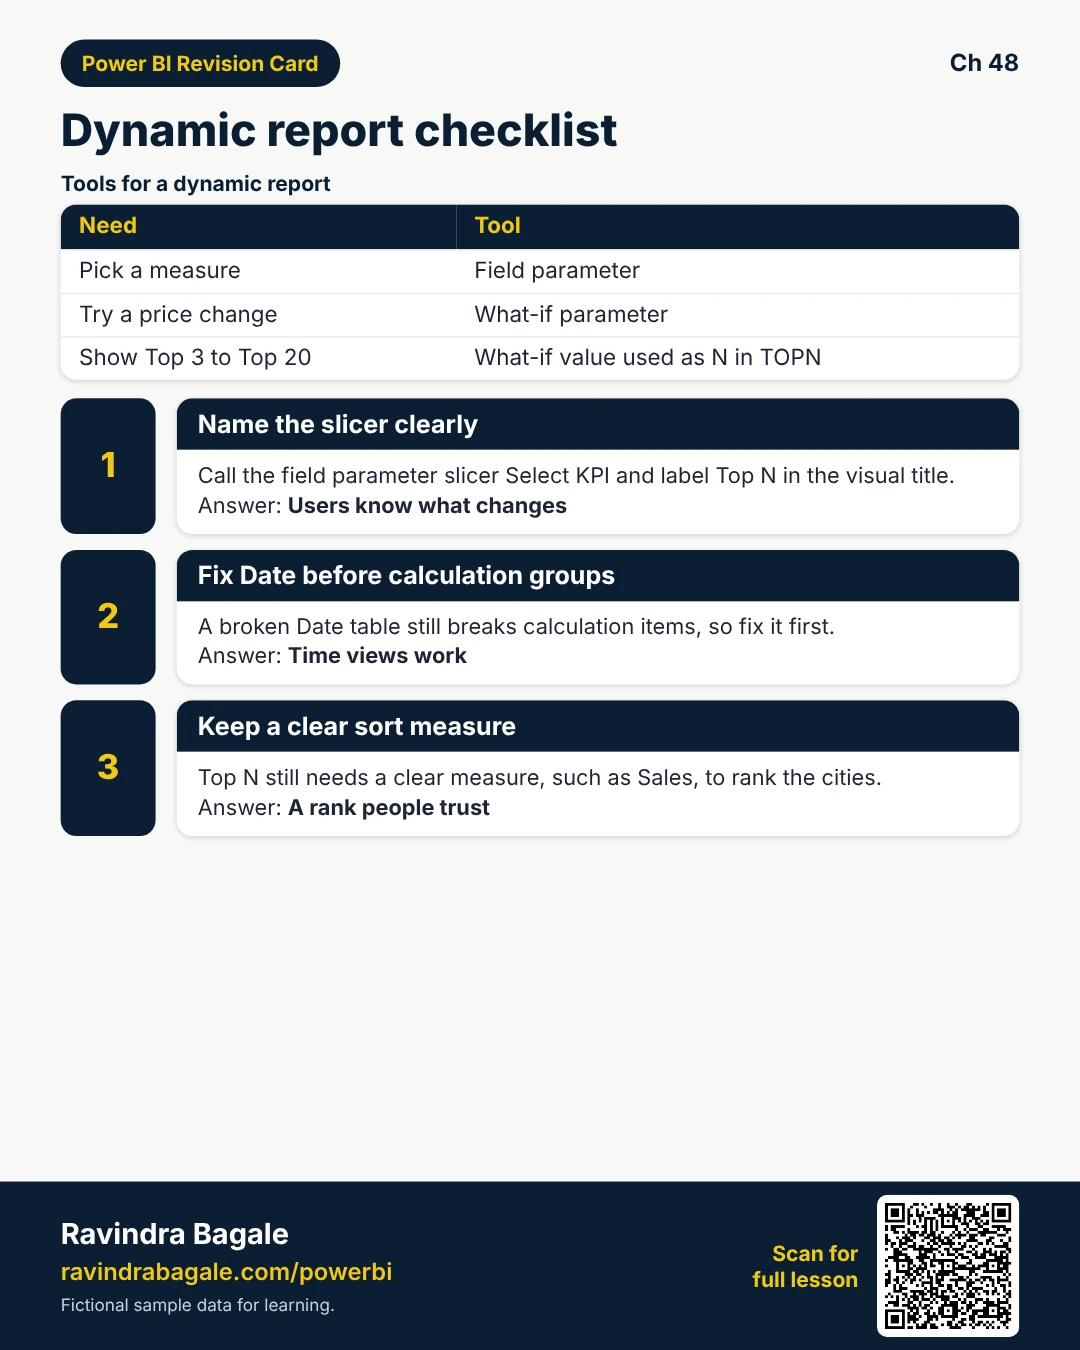
- Name the slicer Select KPI.
Tiny example: One bar chart toggles Sales INR vs Orders — same axis City.
Ravindra Bagale's Tip
Friends, field parameters are report UX — they do not replace a clean measure table.
Ravindra Bagale's Tip – मराठी
मित्रांनो, field parameters म्हणजे report UX — स्वच्छ measure table ची जागा नाही.
Ravindra Bagale's Tip – हिंदी
दोस्तों, field parameters report UX हैं — साफ़ measure table की जगह नहीं।
2. What-if parameters
Why: Managers ask what if price rises 5 percent.
What: A what-if parameter creates a generated series and a slicer for numeric scenarios.
How — wire a scenario:
Vertical steps (one under another)
- New parameter, then What-if, then percent from -10 to 10.
- Use the parameter value in a measure: Sales Scenario = [Sales] * (1 + Parameter).
- Show base vs scenario cards.
- Label assumptions on the page.
- Do not treat what-if as official forecast without finance.
Tiny example: Cold-store price +5 percent scenario vs base demand (fictional teaching).
Ravindra Bagale's Tip
Friends, what-if is a calculator — write the assumption in the title.
Ravindra Bagale's Tip – मराठी
मित्रांनो, what-if कॅल्क्युलेटर आहे — title मध्ये assumption लिहा.
Ravindra Bagale's Tip – हिंदी
दोस्तों, what-if कैलकुलेटर है — title में assumption लिखें।
3. Calculation groups (Tabular Editor overview)
Why: Dozens of time versions of every measure explode the model.
What: A calculation group applies calc items (like Current, LY, YTD) to base measures — usually authored with external tools (e.g. Tabular Editor) on a capacity/compatible model.
How — know the idea:
Vertical steps (one under another)
- One base measure [Sales].
- Calc items: Current, LY, YTD, YoY%.
- User picks calc item in a slicer.
- Learn tooling and governance with Training before Prod.
- Respect format strings and precedence.
Tiny example: Four time views without four measure copies each (concept).
Ravindra Bagale's Tip
Friends, calc groups are senior tooling — practise in Dev, not live Prod on Friday.
Ravindra Bagale's Tip – मराठी
मित्रांनो, calc groups senior tooling — Dev मध्ये सराव, शुक्रवारी Prod नाही.
Ravindra Bagale's Tip – हिंदी
दोस्तों, calc groups senior tooling — Dev में अभ्यास, शुक्रवार Prod नहीं।
4. Time-intel calc items pattern
Why: The pattern is: item expression wraps SELECTEDMEASURE().
What: Each calc item defines how to transform the selected measure under time filters.
How — sketch items:
Vertical steps (one under another)
- Current: SELECTEDMEASURE().
- LY: CALCULATE(SELECTEDMEASURE(), SAMEPERIODLASTYEAR(...)).
- YTD: CALCULATE(SELECTEDMEASURE(), DATESYTD(...)).
- Test with one measure first.
- Document item list for Training.
Tiny example: Same pattern later reused for [Margin] without new measures (concept).
Ravindra Bagale's Tip
Friends, broken Date still breaks calc items — fix Date before fancy groups.
Ravindra Bagale's Tip – मराठी
मित्रांनो, Date तुटले की calc items तुटतात — आधी Date.
Ravindra Bagale's Tip – हिंदी
दोस्तों, Date टूटे तो calc items टूटते हैं — पहले Date।
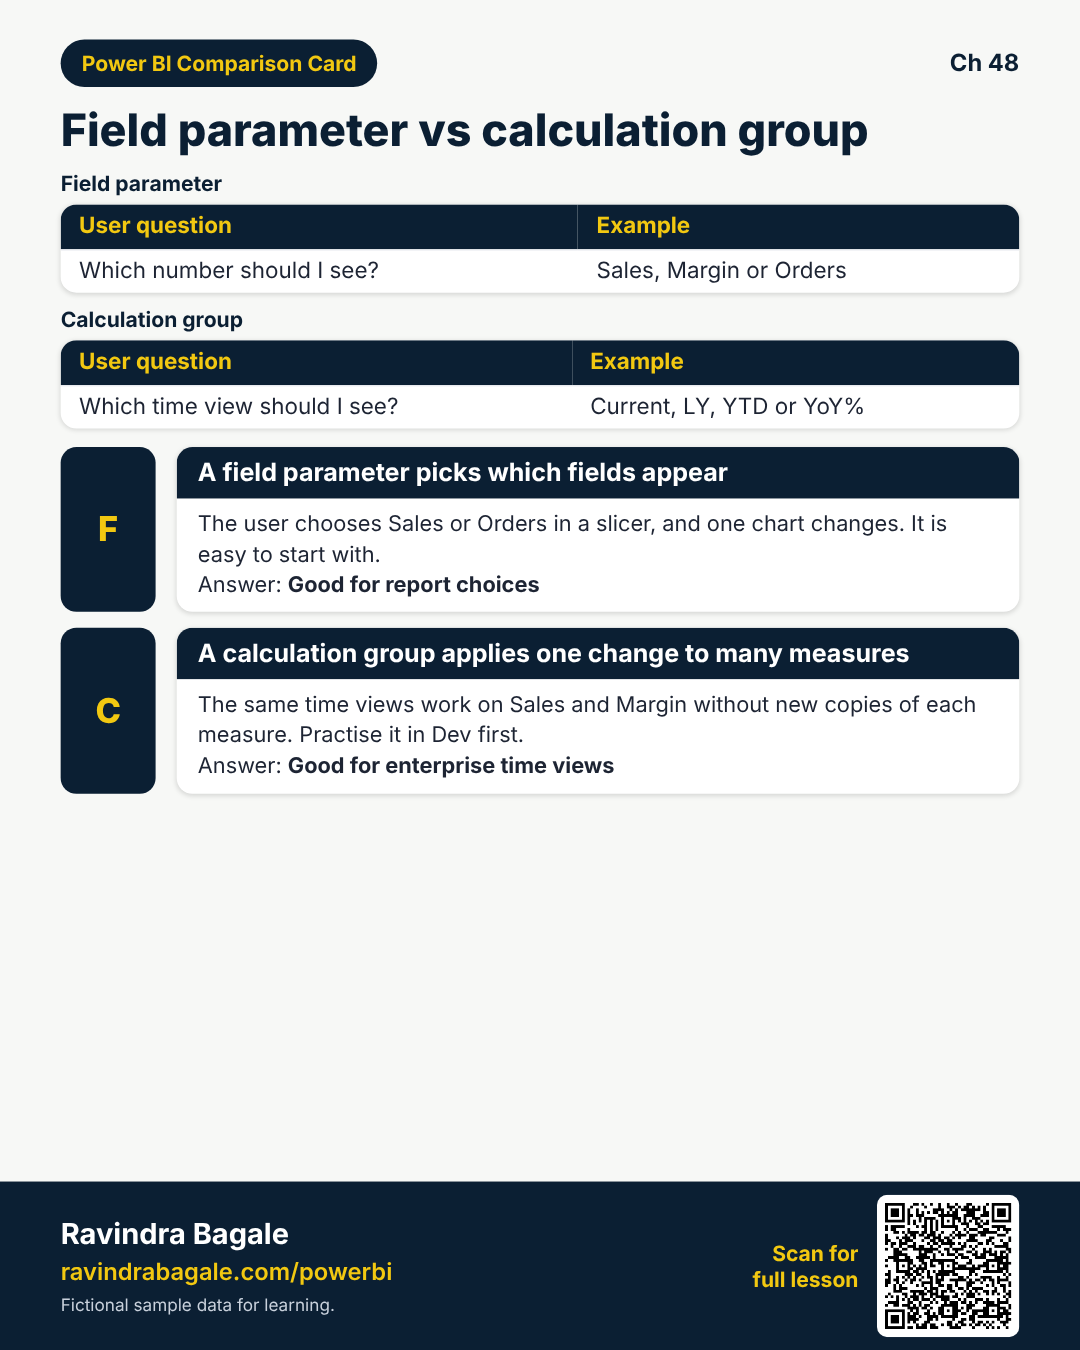
5. Field parameter vs calculation group — when which
Why: Using the wrong tool confuses authors.
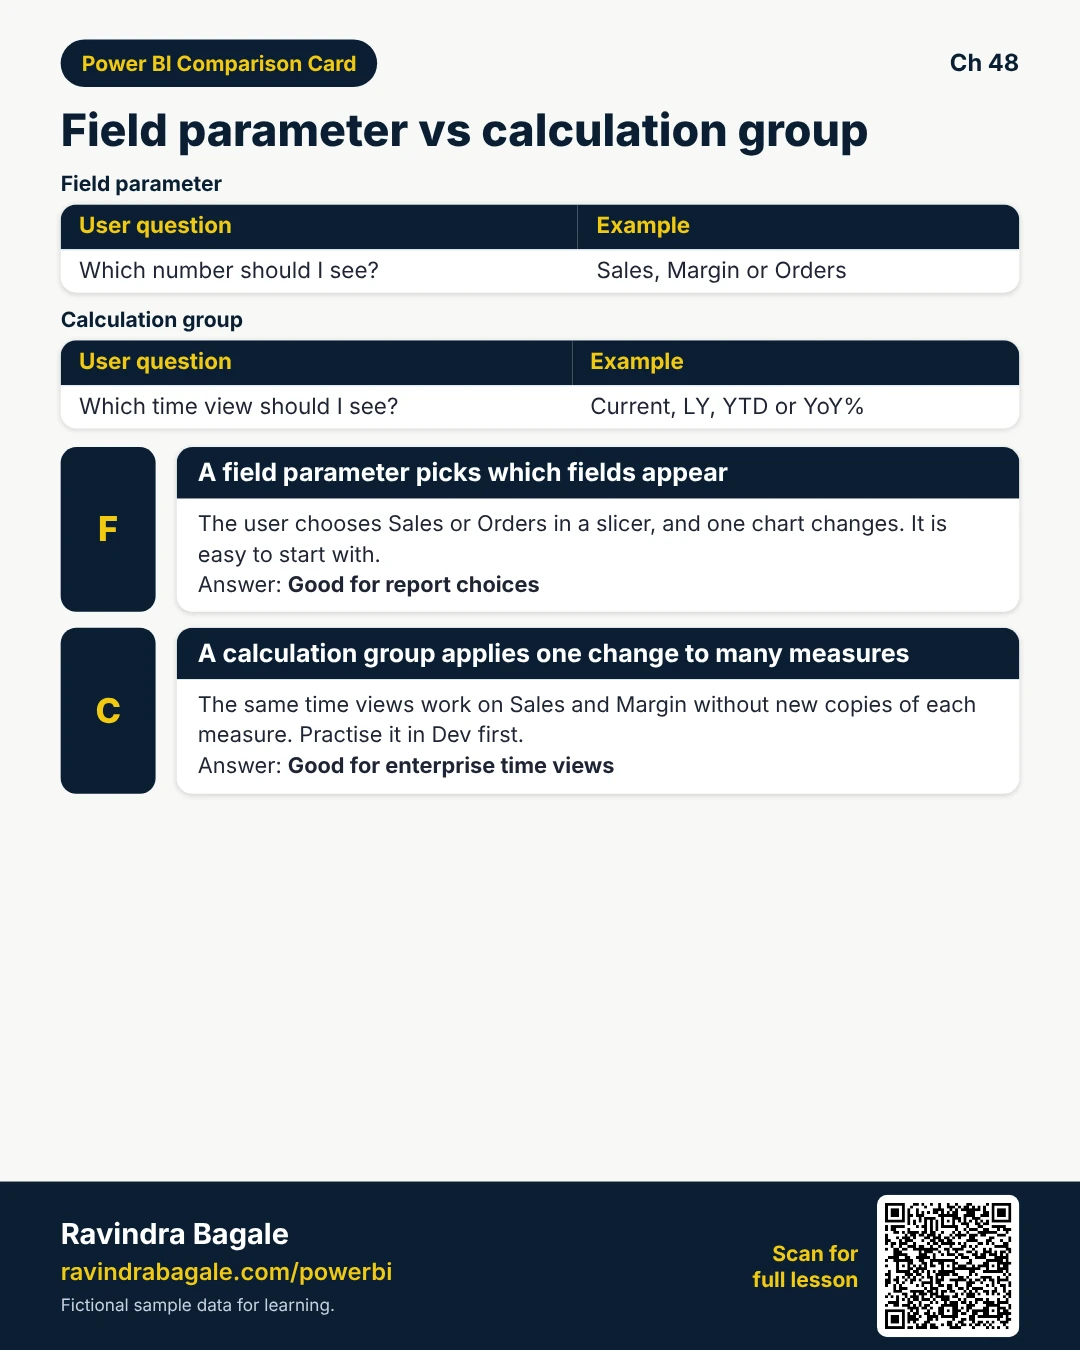
What: Field parameter: pick which fields appear. Calculation group: apply the same time/logic transform to many measures.
How — choose in 20 seconds:
Vertical steps (one under another)
- User picks Sales vs Margin vs Orders? Field parameter.
- User picks Current vs LY vs YTD for any measure? Calc group.
- Need a simple classroom demo? Start with field parameter.
- Need enterprise time views? Plan calc groups with Training.
- You can combine carefully — do not stack chaos.
Tiny example: Mei Lin starts with field parameter this sprint; calc groups next quarter after Dev labs.
Ravindra Bagale's Tip
Friends, say the user question first — tool second.
Ravindra Bagale's Tip – मराठी
मित्रांनो, आधी user चा प्रश्न — नंतर tool.
Ravindra Bagale's Tip – हिंदी
दोस्तों, पहले user का प्रश्न — फिर tool।
6. Dynamic Top N with a parameter
Why: Hard-coded Top 5 frustrates managers who want Top 10.
What: What-if or parameter drives N in TOPN / FILTER patterns.
How — make N dynamic:
Vertical steps (one under another)
- Create what-if N from 3 to 20.
- VAR N = ParameterValue.
- Return TOPN(N, CitiesBySales, [Sales]).
- Bind a visual to the result pattern your course uses.
- Label Top N on the title.
Tiny example: City rank Top N slicer for MH Ops (fictional).
Ravindra Bagale's Tip
Friends, Top N still needs clear sort measure — chaos sort confuses everyone.
Ravindra Bagale's Tip – मराठी
मित्रांनो, Top N ला स्पष्ट sort measure हवे.
Ravindra Bagale's Tip – हिंदी
दोस्तों, Top N को साफ़ sort measure चाहिए।
Quiz (5 questions)
1. Field parameters mainly let users:
2. What-if parameters are good for:
3. Calculation groups help when:
4. SELECTEDMEASURE() appears in:
5. Dynamic Top N usually needs:
Practice tasks (12) — hints only, no full answers
- Task. List three measures for a KPI field parameter.
Hint: section 1. - Task. What-if +/- 10 percent — write scenario measure idea.
Hint: section 2. - Task. Calc group in one sentence for an interview.
Hint: section 3. - Task. Sketch four time-intel calc item names.
Hint: section 4. - Task. Field parameter vs calc group — choose for Sales vs Margin toggle.
Hint: section 5. - Task. Choose tool for Current vs LY vs YTD on any measure.
Hint: calc group. - Task. Dynamic Top N 3-20 — outline VARs.
Hint: section 6. - Task. Why practise calc groups in Dev first?
Hint: section 3 tip. - Task. Mei Lin five visuals problem — which first fix?
Hint: story. - Task. Label plan for what-if assumptions on page.
Hint: section 2. - Task. Risk of 50 undocumented calc items?
Hint: governance. - Task. Does field parameter replace RLS?
Hint: no.
Ravi Sir's cards (Excel card style)
Standalone cards — no tip or photo sections. QR points to this lesson. Download PNG to revise offline.
Think like a professional
In a real tenant, rights and sharing are controlled by Fabric / Power BI admins. Always follow your company policy. This lesson uses fictional people and numbers so you can practise the ideas safely.