47.1 Time Intelligence Patterns
Chala mitrano — MTD, YTD, same period last year, rolling 30/90 — correctly, with a real Date table and India fiscal Apr-Mar.
चला मित्रांनो — MTD, YTD, last year same period, rolling 30/90 — बरोबर, खऱ्या Date table आणि India fiscal Apr-Mar सह.
चला मित्रों — MTD, YTD, last year same period, rolling 30/90 — सही, असली Date table और India fiscal Apr-Mar के साथ।
- Mark a proper Date table and state calendar rules.
- Build YTD / MTD with DATESYTD / TOTALYTD patterns.
- Compare SAMEPERIODLASTYEAR vs DATEADD.
- Create rolling 30/90 windows.
- Explain semi-additive stock/balance measures.
- Handle India fiscal year April-March.
Start with a problem (fictional). Ananya Iyer (finance, fictional) asked for FY YTD from April, not January. Kabir used TOTALYTD with calendar year and the board pack was wrong by three months. Priya marks Date, builds fiscal helpers, and shows rolling 30 for ops beside FY YTD for finance.
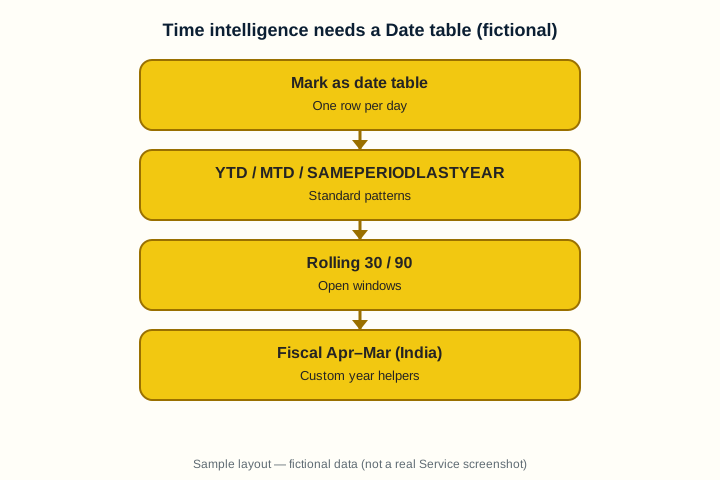
1. Mark as date table and calendar rules
Why: Time intelligence lies without a continuous Date table.
What: A Date table has one row per day, no gaps in the used range, and is marked as the date table.
How — build the foundation:
Vertical steps (one under another)
- Create Date with Year, Month, MonthName, Quarter, DateKey.
- Relate Date[Date] to Sales[OrderDate] many-to-one.
- Mark as date table on the Date column.
- Hide the fact date column from report view if you guide users to Date.
- Refuse auto date/time for serious models.
Tiny example: Date from 2022-01-01 to today+1 year (fictional lab) covers MH history.
Ravindra Bagale's Tip
Friends, gaps in Date break time intel — fill holidays too as rows (sales may be zero).
Ravindra Bagale's Tip – मराठी
मित्रांनो, Date मध्ये gaps time intel मोडतात — सुट्ट्याही rows म्हणून ठेवा.
Ravindra Bagale's Tip – हिंदी
दोस्तों, Date में gaps time intel तोड़ते हैं — छुट्टियाँ भी rows रखें।
2. YTD / MTD patterns
Why: Boards ask year-to-date without manual month filters every time.
What: DATESYTD / TOTALYTD (and month cousins) compute period-to-date under filter context.
How — write YTD:
Vertical steps (one under another)
- Sales YTD = TOTALYTD([Sales], 'Date'[Date]) or CALCULATE with DATESYTD.
- Test with a month slicer — YTD should accumulate inside the year.
- Keep City slicers — only dates shift.
- Name measures clearly (Sales YTD).
- Compare to a manual sum of months for one city.
Tiny example: Nashik Sales YTD in June shows Apr-Jun or Jan-Jun depending on year config (see fiscal section).
Ravindra Bagale's Tip
Friends, YTD without a marked Date table is a trap — fix Date first.
Ravindra Bagale's Tip – मराठी
मित्रांनो, marked Date शिवाय YTD सापळा आहे — आधी Date.
Ravindra Bagale's Tip – हिंदी
दोस्तों, marked Date के बिना YTD जाल है — पहले Date।
3. SAMEPERIODLASTYEAR and friends
Why: YoY needs last year’s parallel dates, not a hard-coded year.
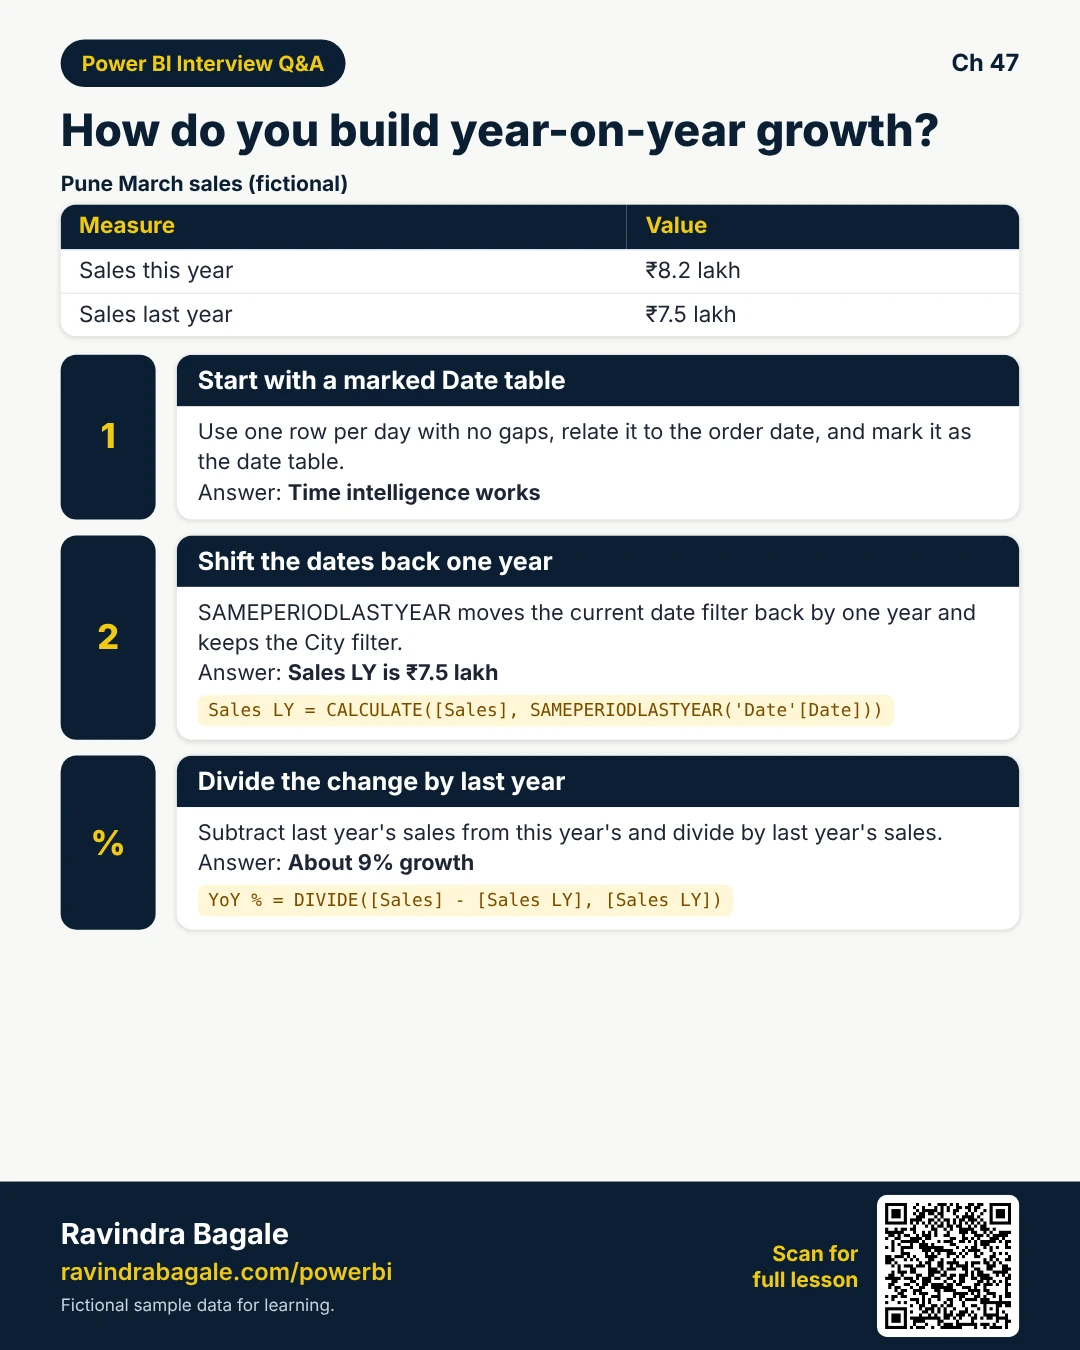
What: SAMEPERIODLASTYEAR shifts the current date filter back one year; DATEADD is more general.
How — build YoY:
Vertical steps (one under another)
- Sales LY = CALCULATE([Sales], SAMEPERIODLASTYEAR('Date'[Date])).
- YoY % = DIVIDE([Sales]-[Sales LY], [Sales LY]).
- Test February in a leap-year edge carefully.
- Keep other filters (City) intact.
- Show LY and YoY % side by side.
Tiny example: Pune March sales INR 8.2L vs LY INR 7.5L → YoY about +9% (fictional).
Ravindra Bagale's Tip
Friends, if LY is blank, check Date coverage for last year — not only DAX.
Ravindra Bagale's Tip – मराठी
मित्रांनो, LY रिकामे असेल तर गेल्या वर्षाचे Date coverage पाहा.
Ravindra Bagale's Tip – हिंदी
दोस्तों, LY खाली हो तो पिछले वर्ष का Date coverage देखें।
4. Rolling 30 / 90 windows
Why: Ops wants last 30 days, not calendar month.
What: Use DATESINPERIOD or DATEADD windows from the last selected day (often MAX Date).
How — build rolling:
Vertical steps (one under another)
- Find last day in context: VAR LastDay = MAX('Date'[Date]).
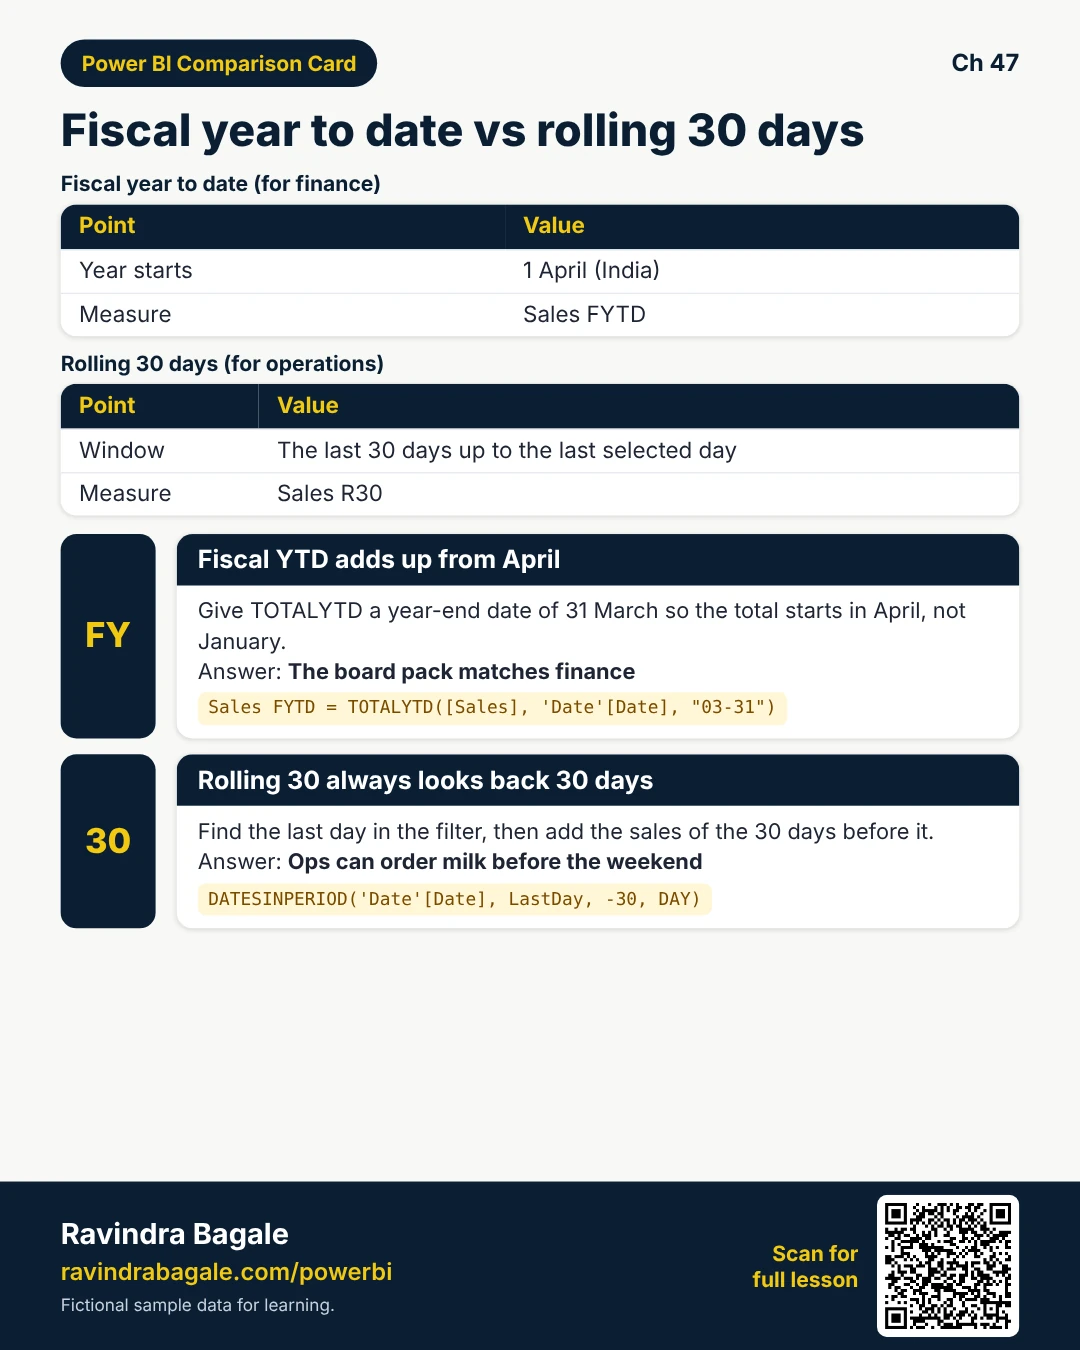
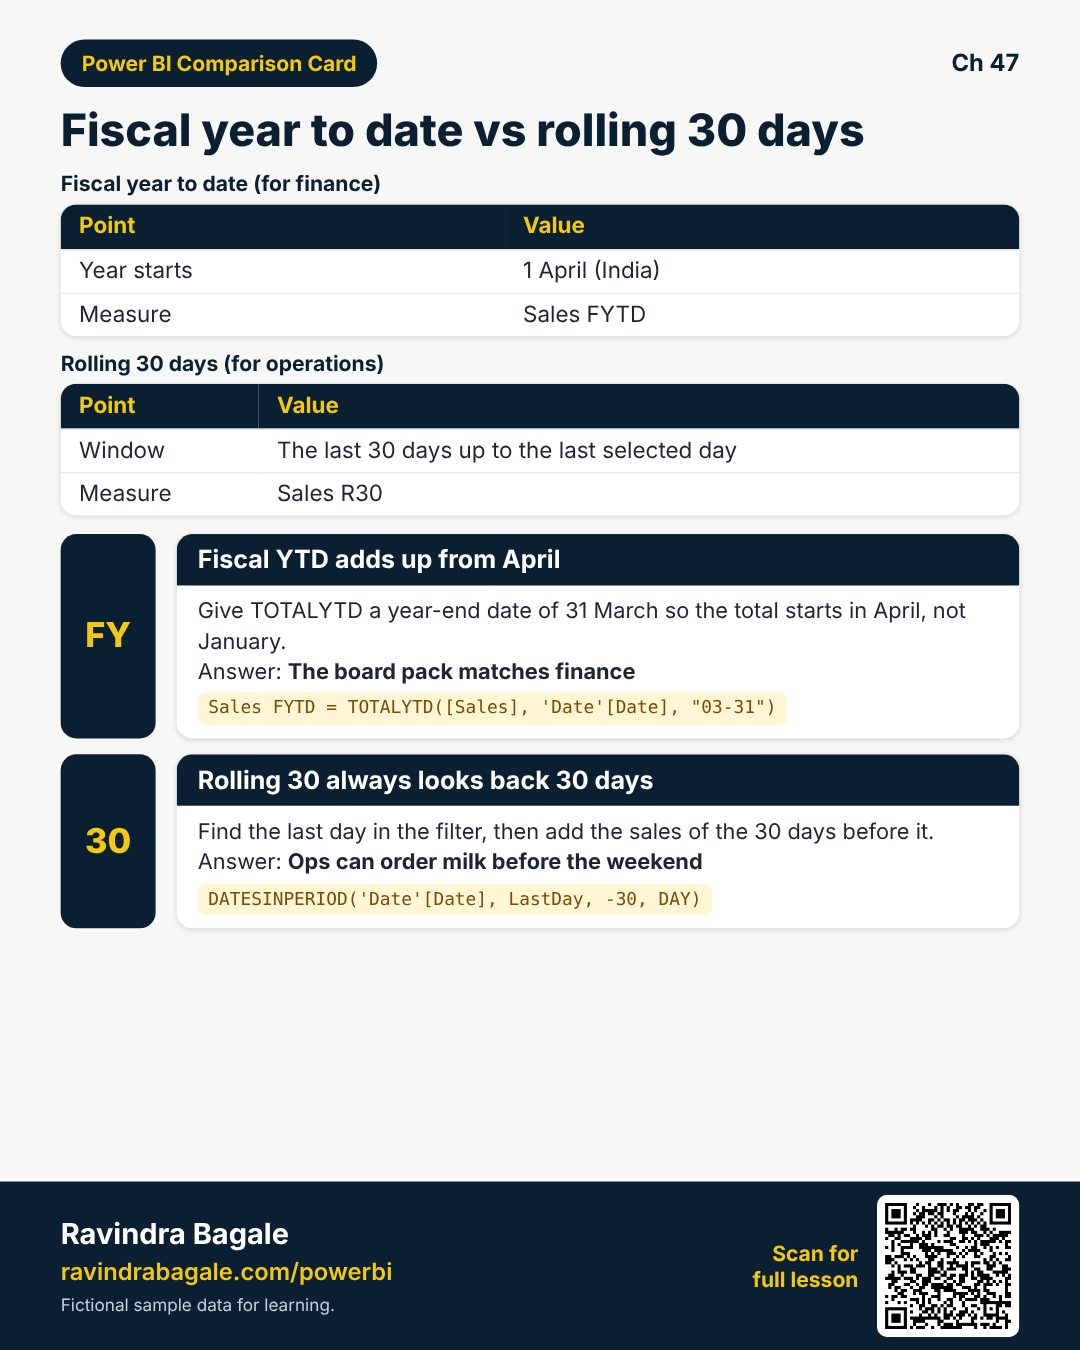
- Sales R30 = CALCULATE([Sales], DATESINPERIOD('Date'[Date], LastDay, -30, DAY)).
- Same for -90.
- Label visuals Last 30 days clearly.
- Do not mix rolling and MTD without labels.
Tiny example: Cold-store R30 demand helps Aarav order milk before weekend (fictional).
Ravindra Bagale's Tip
Friends, rolling windows need enough Date rows behind LastDay — extend Date table.
Ravindra Bagale's Tip – मराठी
मित्रांनो, rolling ला LastDay मागे पुरेशा Date rows हव्यात.
Ravindra Bagale's Tip – हिंदी
दोस्तों, rolling को LastDay के पीछे पर्याप्त Date rows चाहिए।
5. Semi-additive measures (stock / balance)
Why: Summing inventory across days double-counts stock.
What: Semi-additive measures take last (or average) across time, but sum across products/cities.
How — think last balance:
Vertical steps (one under another)
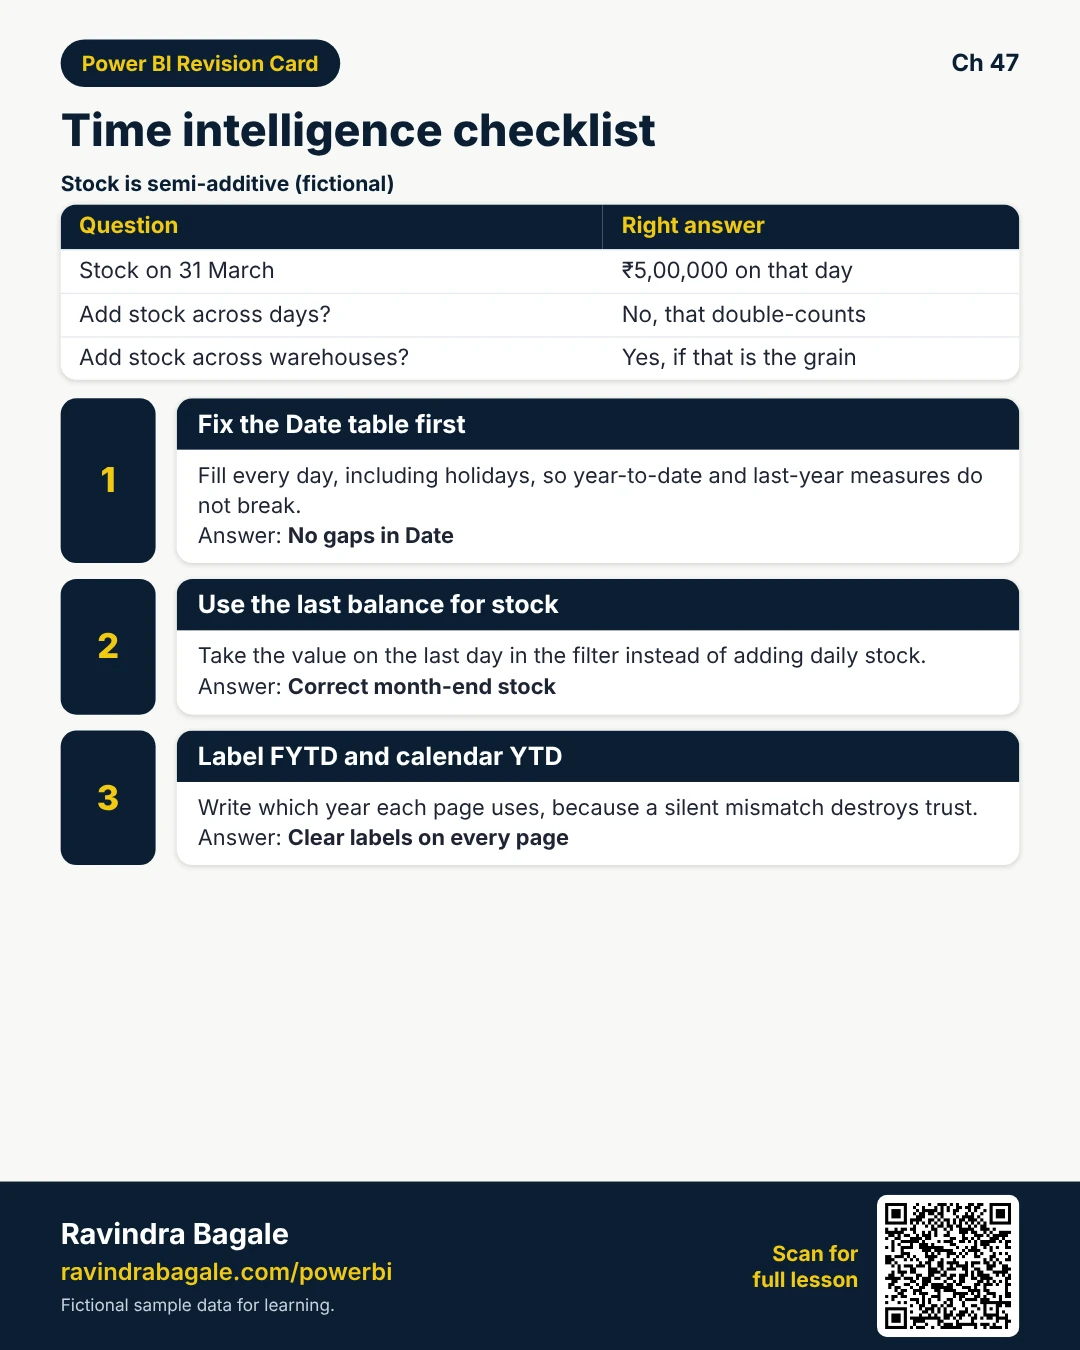
- Inventory should not SUM across dates.
- Use LASTDATE / LASTNONBLANK patterns with CALCULATE.
- Still SUM across warehouses if that is the grain.
- Test month end vs mid-month.
- Document: balance as of last day in filter.
Tiny example: Stock INR 5,00,000 on 31-Mar — not sum of daily stocks (fictional).
Ravindra Bagale's Tip
Friends, interview buzzword semi-additive means: sum some dimensions, not time.
Ravindra Bagale's Tip – मराठी
मित्रांनो, semi-additive = काही dimensions sum, वेळ नाही.
Ravindra Bagale's Tip – हिंदी
दोस्तों, semi-additive = कुछ dimensions sum, समय नहीं।
6. Fiscal year April-March (India)
Why: Indian companies often start FY in April — calendar YTD misleads boards.
What: Use fiscal year/month columns or TOTALYTD with year_end_date argument (e.g. "03-31").
How — align to finance:
Vertical steps (one under another)
- Add FiscalYear label (FY25 = Apr 2024-Mar 2025) on Date.
- Sales FYTD = TOTALYTD([Sales], 'Date'[Date], "03-31").
- Validate with finance for one known month.
- Put FY slicers on reports for boards.
- Keep calendar YTD only if ops truly wants it — label both.
Tiny example: Board pack uses FYTD from April; ops R30 stays calendar rolling (fictional split).
Ravindra Bagale's Tip
Friends, label FYTD vs CYTD on every page — silent mismatch destroys trust.
Ravindra Bagale's Tip – मराठी
मित्रांनो, प्रत्येक पानावर FYTD vs CYTD लेबल — शांत चुक विश्वास मोडते.
Ravindra Bagale's Tip – हिंदी
दोस्तों, हर पेज पर FYTD vs CYTD लेबल — चुप गलती विश्वास तोड़ती है।
Quiz (5 questions)
1. Time intelligence needs:
2. SAMEPERIODLASTYEAR is commonly used for:
3. Rolling 30 days often uses:
4. Inventory across days should usually:
5. India fiscal YTD often ends year on:
Practice tasks (12) — hints only, no full answers
- Task. List five columns on a good Date table.
Hint: section 1. - Task. Why mark as date table?
Hint: time intel. - Task. Write Sales YTD measure idea.
Hint: section 2. - Task. Sales LY + YoY % sketch.
Hint: section 3. - Task. Rolling 90 — when ops prefers it over MTD.
Hint: section 4. - Task. Semi-additive: stock example in two lines.
Hint: section 5. - Task. TOTALYTD with 03-31 — what FY does June belong to?
Hint: section 6. - Task. Label plan: FYTD vs R30 on one report page.
Hint: story. - Task. Leap year February YoY — what do you retest?
Hint: section 3. - Task. Interview: what breaks without continuous Date?
Hint: gaps. - Task. Why hide fact OrderDate from report view sometimes?
Hint: guide to Date. - Task. Ananya board pack wrong by 3 months — root cause?
Hint: story.
Ravi Sir's cards (Excel card style)
Standalone cards — no tip or photo sections. QR points to this lesson. Download PNG to revise offline.
Think like a professional
In a real tenant, rights and sharing are controlled by Fabric / Power BI admins. Always follow your company policy. This lesson uses fictional people and numbers so you can practise the ideas safely.