46.1 Iterators, Tables in DAX and Virtual Tables
Chala mitrano — sometimes SUM is enough; sometimes you must walk row by row with SUMX. Virtual tables are temporary — use them clearly.
चला मित्रांनो — कधी SUM पुरेसे; कधी SUMX ने row-by-row चालावे. Virtual tables तात्पुरत्या — स्पष्ट वापरा.
चला मित्रों — कभी SUM काफी; कभी SUMX से row-by-row चलें। Virtual tables अस्थायी — साफ़ इस्तेमाल करें।
- Choose SUM vs SUMX with a reason.
- Build a filtered virtual table with FILTER.
- Shape columns with ADDCOLUMNS / SELECTCOLUMNS.
- Summarise with SUMMARIZE carefully.
- Keep virtual tables readable and small.
- Explain iterators in an interview.
Start with a problem (fictional). Carlos Mendes (Lisbon retail analytics, fictional) needed average discount per invoice, not discount of averages. SUM failed. SUMX over invoices fixed it. Then he overgrew a SUMMARIZE of every product daily and the report froze — Priya taught smaller virtual tables.
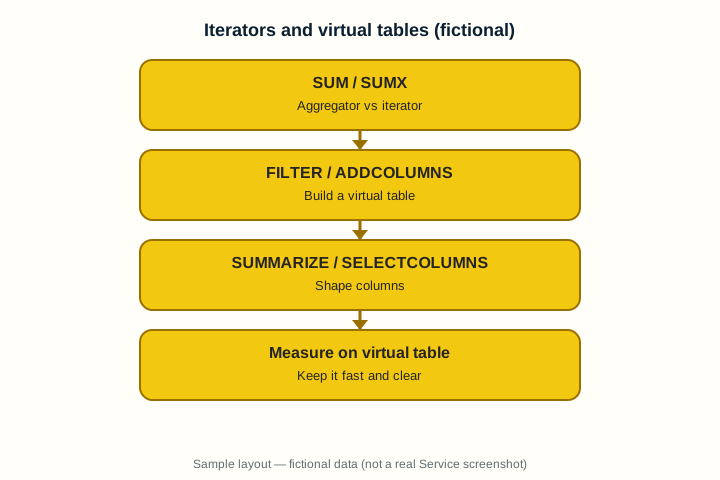
1. SUM vs SUMX — aggregator vs iterator
Why: Average of ratios is not ratio of averages — iterators matter.
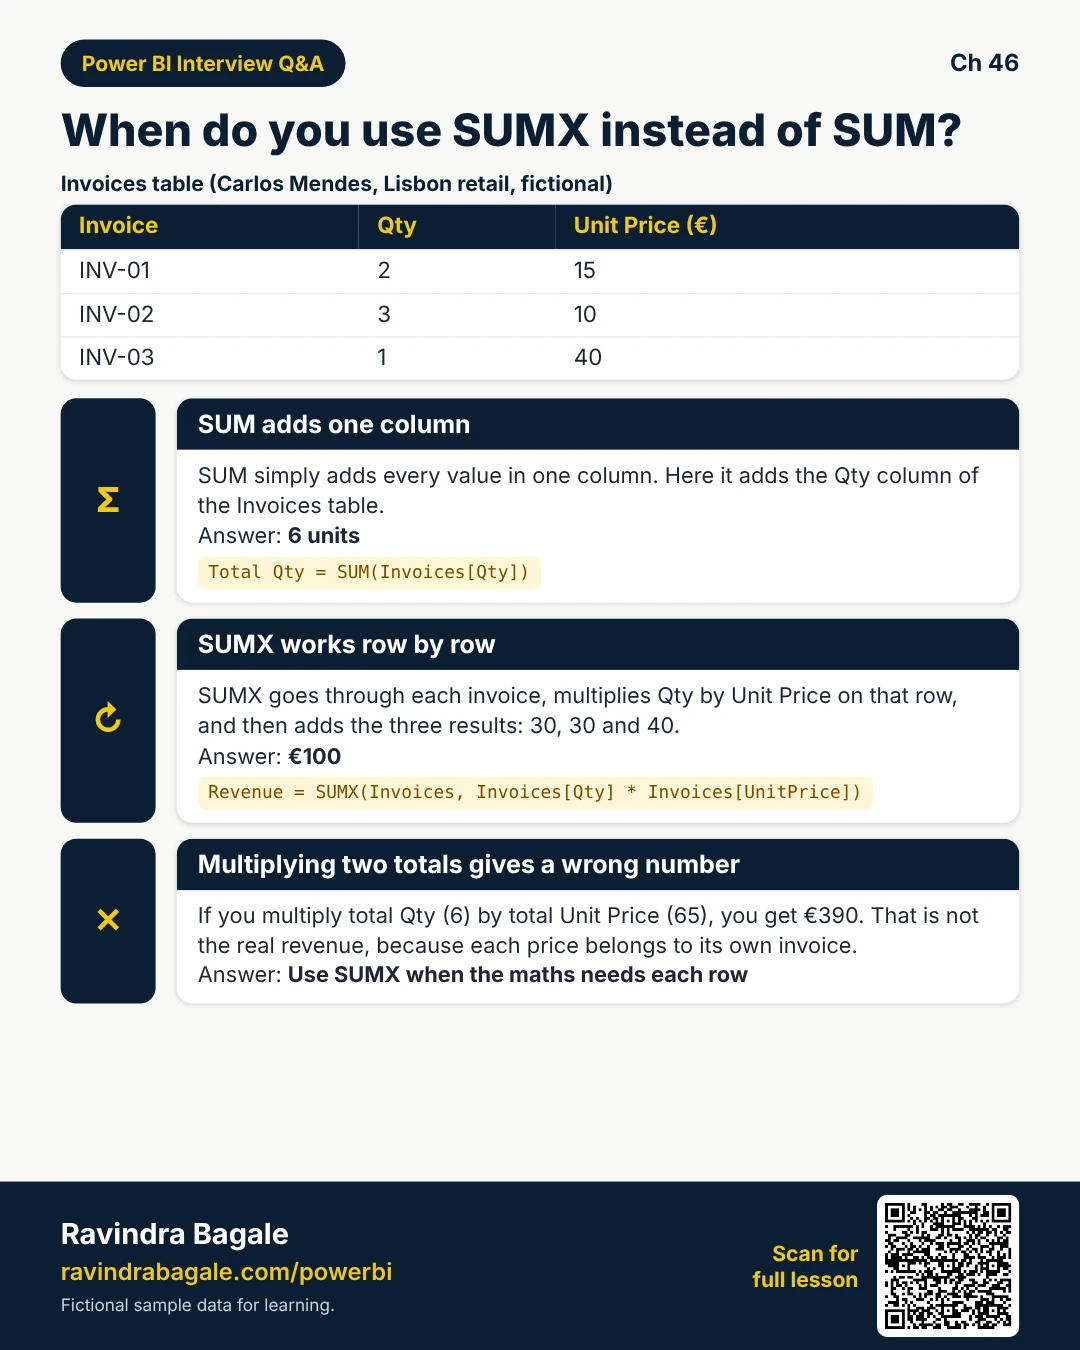
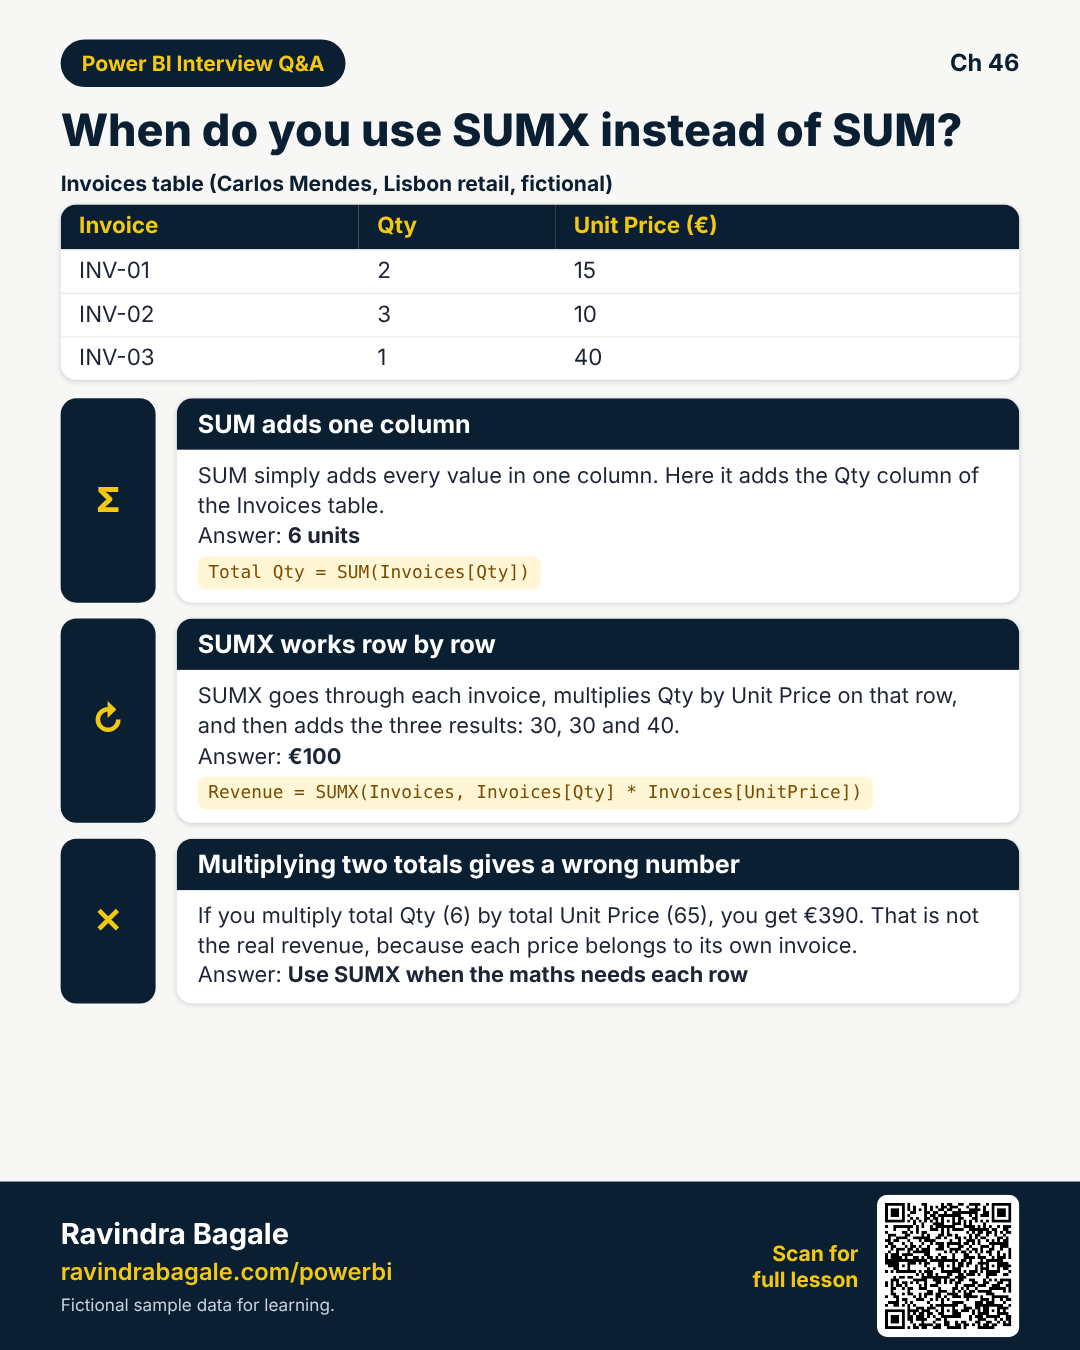
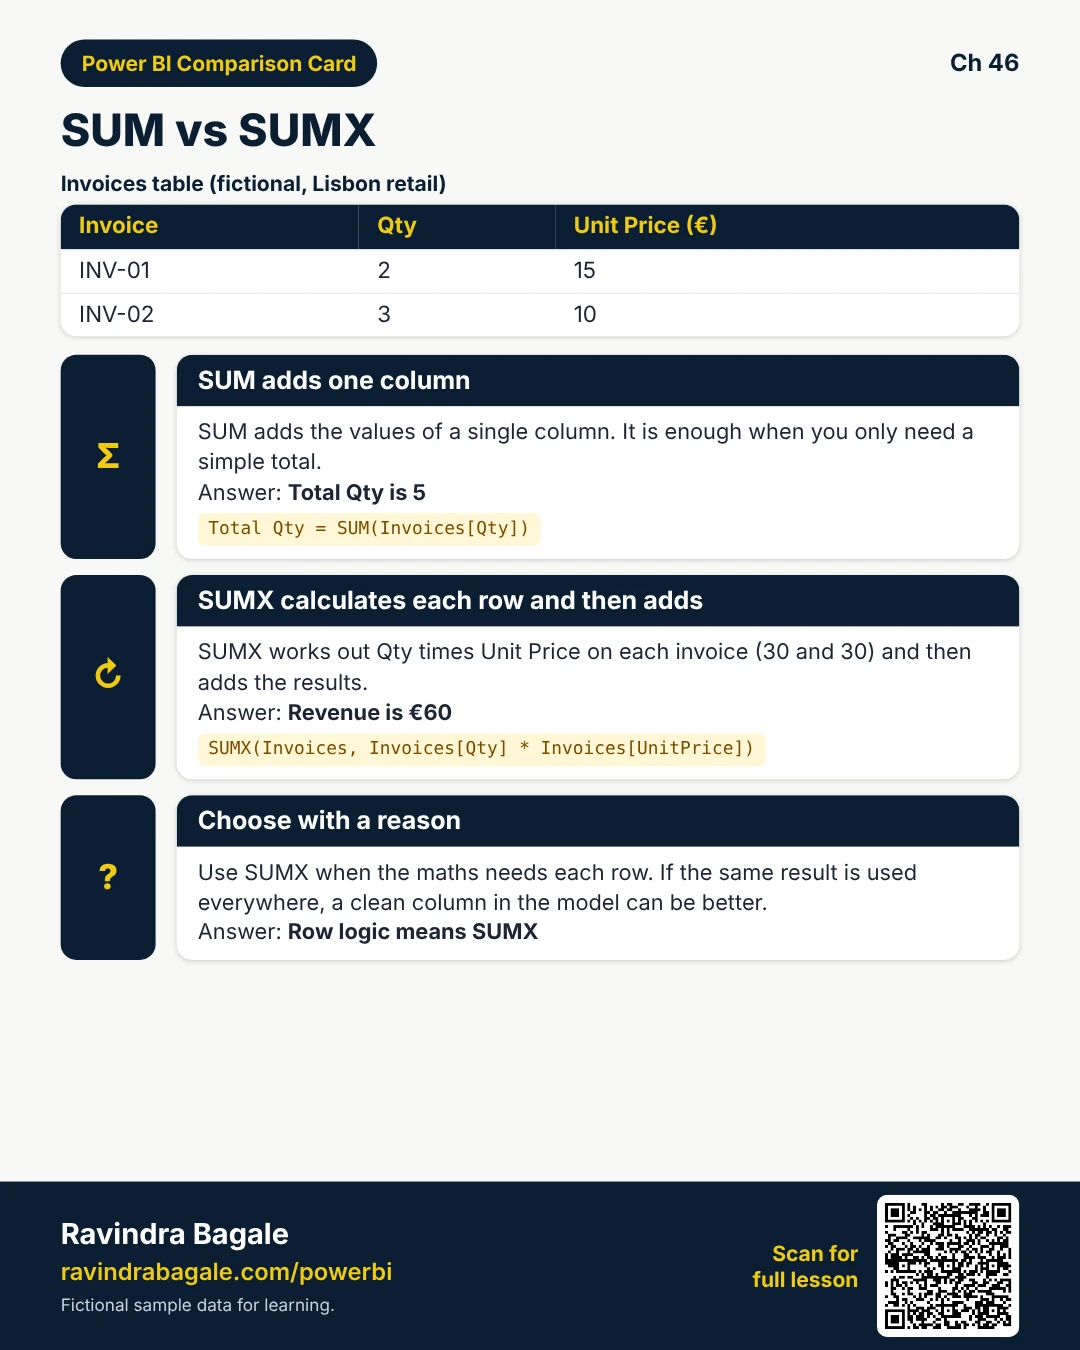
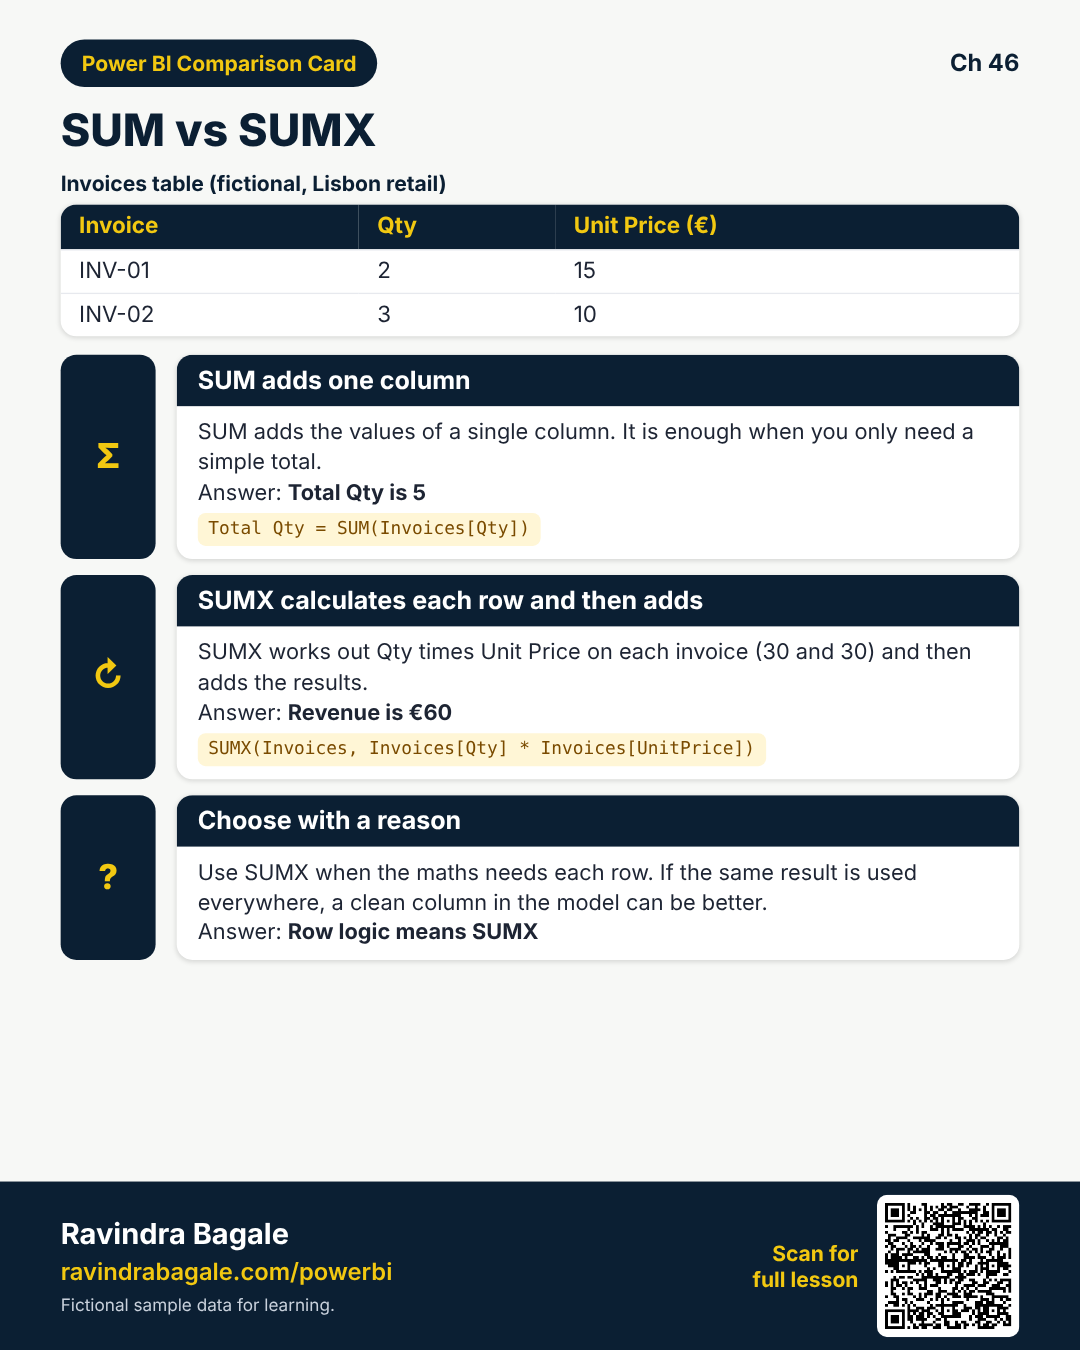
What: SUM adds a column. SUMX iterates a table, evaluates an expression per row, then sums.
How — pick the tool:
Vertical steps (one under another)
- Simple column add? SUM(Sales[Amount]).
- Expression per row (qty * price, conditional)? SUMX.
- Write the table you iterate (Sales, or a filtered subset).
- Test on 10 rows before the full model.
- Prefer a clean column in the model if used everywhere.
Tiny example: LineAmount = SUMX(Sales, Sales[Qty] * Sales[UnitPrice]) — fictional INR.
Ravindra Bagale's Tip
Friends, if the math needs per-row logic, SUMX (or a column) — not hope.
Ravindra Bagale's Tip – मराठी
मित्रांनो, per-row गणित असेल तर SUMX (किंवा column) — आशा नाही.
Ravindra Bagale's Tip – हिंदी
दोस्तों, per-row गणित हो तो SUMX (या column) — आशा नहीं।
2. FILTER builds a virtual table
Why: You often need only rows that match a condition inside a measure.
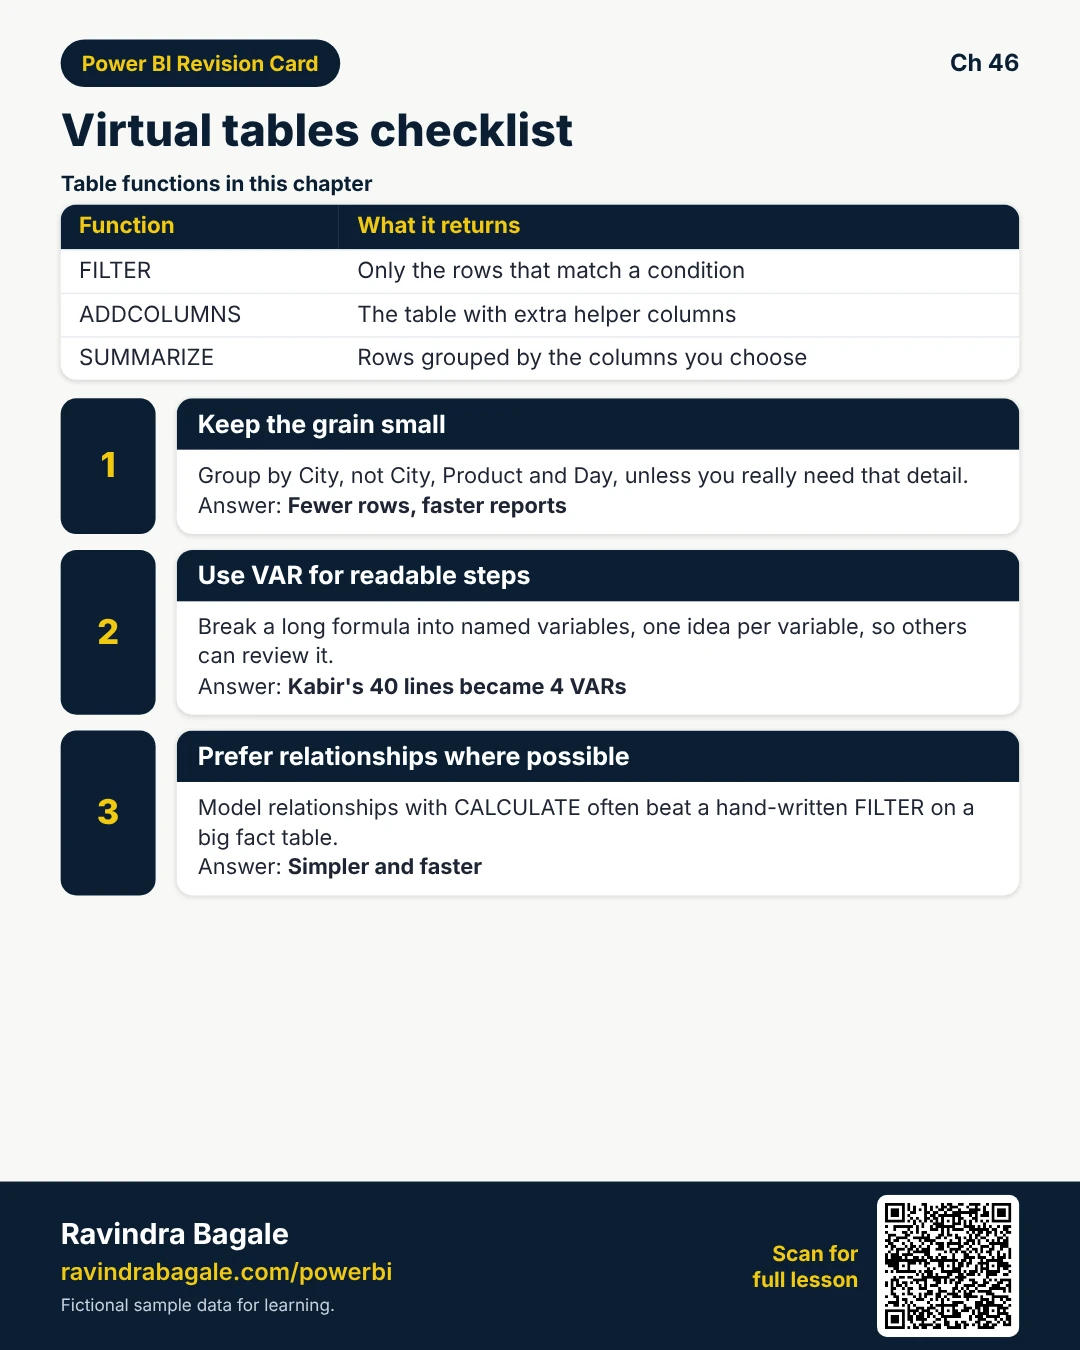
What: FILTER returns a table of rows matching a condition — usually consumed by an iterator or CALCULATE.
How — filter then aggregate:
Vertical steps (one under another)
- Start from a base table (Sales).
- FILTER(Sales, Sales[Qty] > 0).
- Pass into SUMX or use as CALCULATE filter carefully.
- Keep predicates simple.
- Avoid FILTER on huge unneeded columns.
Tiny example: SUMX(FILTER(Sales, Sales[City]="Nashik"), Sales[Amount]) — teaching form; prefer model relationships when possible.
Ravindra Bagale's Tip
Friends, relationships + CALCULATE often beat hand-FILTER on fact tables — know both.
Ravindra Bagale's Tip – मराठी
मित्रांनो, relationship + CALCULATE अनेकदा hand-FILTER पेक्षा चांग — दोन्ही जाणा.
Ravindra Bagale's Tip – हिंदी
दोस्तों, relationship + CALCULATE अक्सर hand-FILTER से बेहतर — दोनों जानें।
3. ADDCOLUMNS and SELECTCOLUMNS
Why: You need helper columns on a virtual table without permanently changing the model.
What: ADDCOLUMNS adds columns; SELECTCOLUMNS builds a shaped table of chosen columns.
How — shape lightly:
Vertical steps (one under another)
- ADDCOLUMNS(City, "Sales", [Sales]) for a small city list.
- SELECTCOLUMNS to return only keys you need.
- Do not materialise monster tables in measures.
- Name virtual columns clearly.
- Prefer calculated columns only when reused heavily.
Tiny example: Tiny city table with a Sales measure column for a top-N visual pattern (concept).
Ravindra Bagale's Tip
Friends, virtual columns are free only until cardinality explodes — watch row counts.
Ravindra Bagale's Tip – मराठी
मित्रांनो, virtual columns cardinality वाढली की महाग — row counts पाहा.
Ravindra Bagale's Tip – हिंदी
दोस्तों, virtual columns cardinality बढ़े तो महंगा — row counts देखें।
4. SUMMARIZE — group with care
Why: Grouped virtual tables power many patterns — and many slow reports.
What: SUMMARIZE groups by columns; newer patterns may use SUMMARIZECOLUMNS — learn both names.
How — group small:
Vertical steps (one under another)
- Summarise at City grain, not City x Product x Day unless needed.
- Add measures carefully after grouping.
- Test query cost mentally: how many groups?
- Push heavy grouping to the model/ETL when stable.
- Document grain in the measure name.
Tiny example: Summarise Sales by City for a small rank table — not every SKU (fictional).
Ravindra Bagale's Tip
Friends, if SUMMARIZE returns hundreds of thousands of groups, redesign.
Ravindra Bagale's Tip – मराठी
मित्रांनो, SUMMARIZE लाखो groups देत असेल तर redesign.
Ravindra Bagale's Tip – हिंदी
दोस्तों, SUMMARIZE लाखों groups दे तो redesign।
5. Keep virtual tables readable
Why: Unreadable DAX is unmaintainable DAX.
What: Break complex table expressions into variables (VAR) with clear names.
How — use VAR:
Vertical steps (one under another)
- VAR Cities = VALUES('City'[CityKey]).
- VAR Ranked = ...
- RETURN SUMX(Ranked, ...)
- One idea per variable.
- Comment grain in one short line.
Tiny example: Kabir 40-line nested FILTER becomes 4 named VARs — Training can review.
Ravindra Bagale's Tip
Friends, VAR is for clarity first — optimise after it is correct.
Ravindra Bagale's Tip – मराठी
मित्रांनो, VAR प्रथम स्पष्टतेसाठी — बरोबर झाल्यावर optimise.
Ravindra Bagale's Tip – हिंदी
दोस्तों, VAR पहले स्पष्टता के लिए — सही होने पर optimise।
6. Interview: iterators in 45 seconds
Why: They ask SUM vs SUMX and what a virtual table is.
What: SUM adds a column; SUMX evaluates per row; virtual tables are temporary results inside DAX.
How — deliver cleanly:
Vertical steps (one under another)
- Give qty x price SUMX example.
- Say FILTER returns a table.
- Mention VAR for readability.
- Warn about large SUMMARIZE grains.
- Prefer model relationships when they replace filters.
Tiny example: Close: I iterate only when the expression needs row logic; otherwise SUM.
Ravindra Bagale's Tip
Friends, say grain out loud — City vs City x Day — interviewers relax.
Ravindra Bagale's Tip – मराठी
मित्रांनो, grain मोठ्याने सांगा — City vs City x Day.
Ravindra Bagale's Tip – हिंदी
दोस्तों, grain ज़ोर से कहें — City vs City x Day।
Quiz (5 questions)
1. Use SUMX when:
2. FILTER returns:
3. ADDCOLUMNS is for:
4. Danger of huge SUMMARIZE grains:
5. VAR in DAX mainly helps you:
Practice tasks (12) — hints only, no full answers
- Task. Write SUM vs SUMX with qty x price example.
Hint: section 1. - Task. When is a model column better than SUMX everywhere?
Hint: reuse. - Task. FILTER Sales to Qty > 0 — sketch measure.
Hint: section 2. - Task. Why prefer relationships over fact FILTER when possible?
Hint: section 2 tip. - Task. ADDCOLUMNS on City with [Sales] — what grain?
Hint: city. - Task. Name a bad SUMMARIZE grain for a morning card.
Hint: section 4. - Task. Refactor a nested expression into 3 VARs (names only).
Hint: section 5. - Task. Interview 45-second SUM vs SUMX.
Hint: section 6. - Task. Carlos average discount — why SUM failed.
Hint: story. - Task. SELECTCOLUMNS use-case in one line.
Hint: section 3. - Task. How do you estimate group count before SUMMARIZE?
Hint: cardinality. - Task. List two signs a virtual table is too big.
Hint: slow / memory.
Ravi Sir's cards (Excel card style)
Standalone cards — no tip or photo sections. QR points to this lesson. Download PNG to revise offline.
Think like a professional
In a real tenant, rights and sharing are controlled by Fabric / Power BI admins. Always follow your company policy. This lesson uses fictional people and numbers so you can practise the ideas safely.