45.1 CALCULATE and Filter Context Mastery
Chala mitrano — CALCULATE is not magic spice. It changes filter context. Today we see why, with small INR examples from MH sales.
चला मित्रांनो — CALCULATE जादूची मसाला नाही. तो filter context बदलतो. आज MH sales च्या छोट्या INR उदाहरणांनी का ते पाहू.
चला मित्रों — CALCULATE जादुई मसाला नहीं। यह filter context बदलता है। आज MH sales के छोटे INR उदाहरणों से क्यों देखेंगे।
- Contrast filter context and row context in plain English.
- Explain what CALCULATE does to filters.
- Use REMOVEFILTERS/ALL patterns carefully.
- Apply KEEPFILTERS when overwrite is wrong.
- Describe context transition with an iterator example.
- Spot interview myths about CALCULATE.
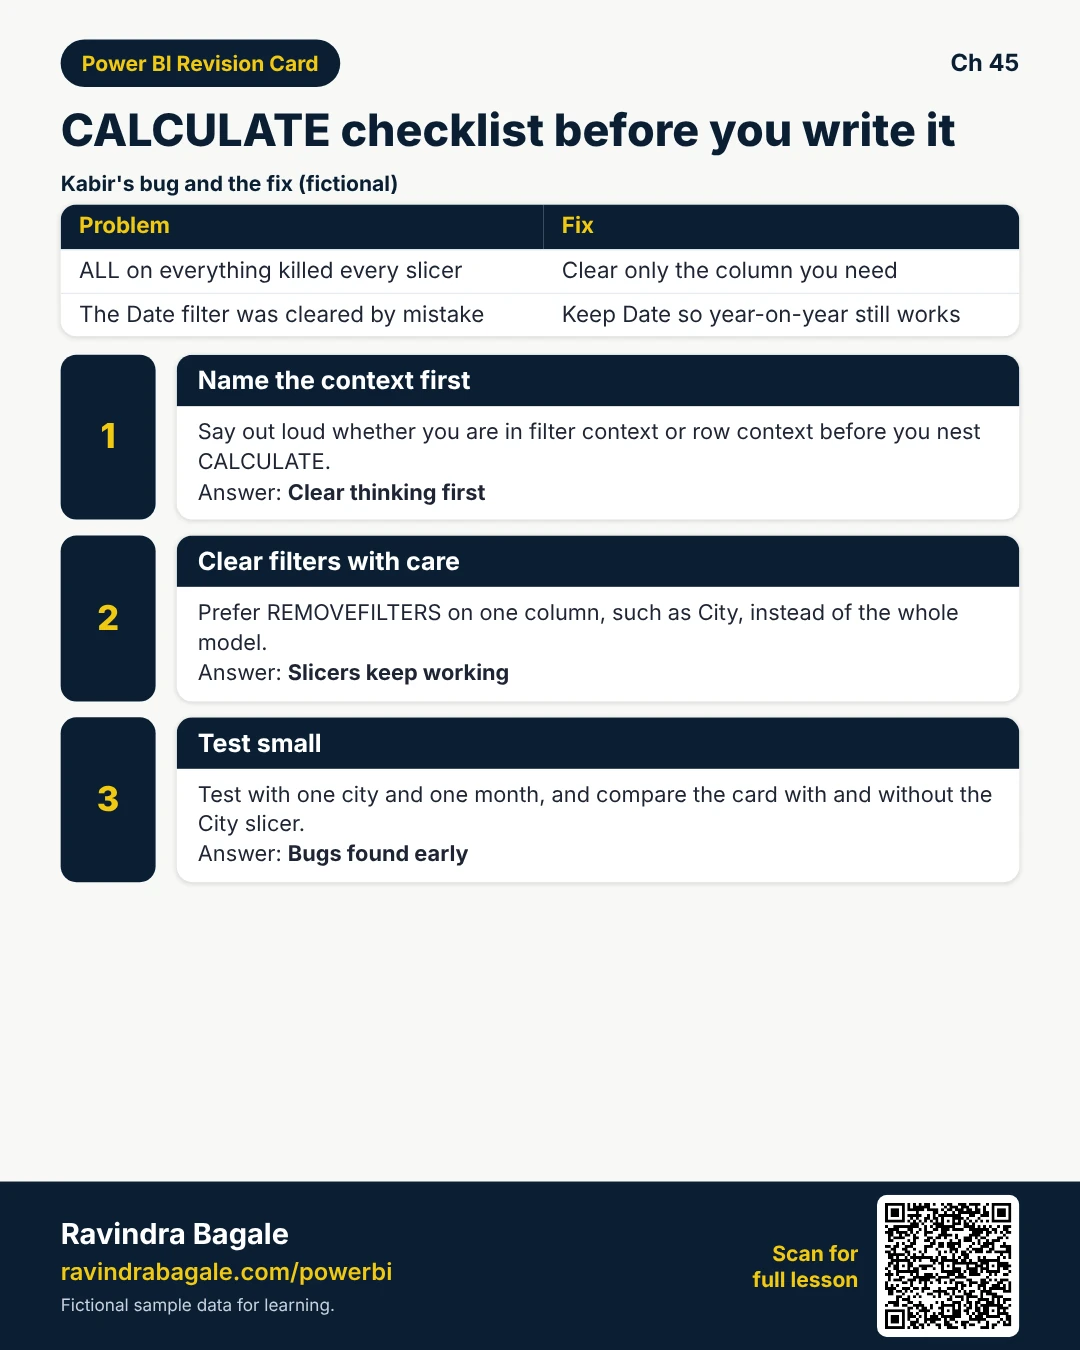
Start with a problem (fictional). Intern Kabir Mehta wrote Sales YoY with CALCULATE but every slicer died. Mentor Priya showed he blanketed the model with ALL(everything). In Nashik vs Pune (fictional), they rebuild: clear only Date when needed, KEEPFILTERS on Region, and respect row context inside SUMX.
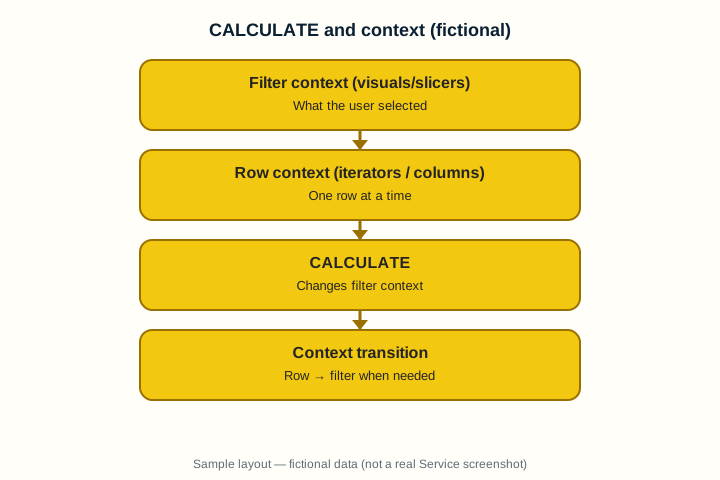
1. Filter context vs row context
Why: Students mix what the visual filtered with which row we are on.
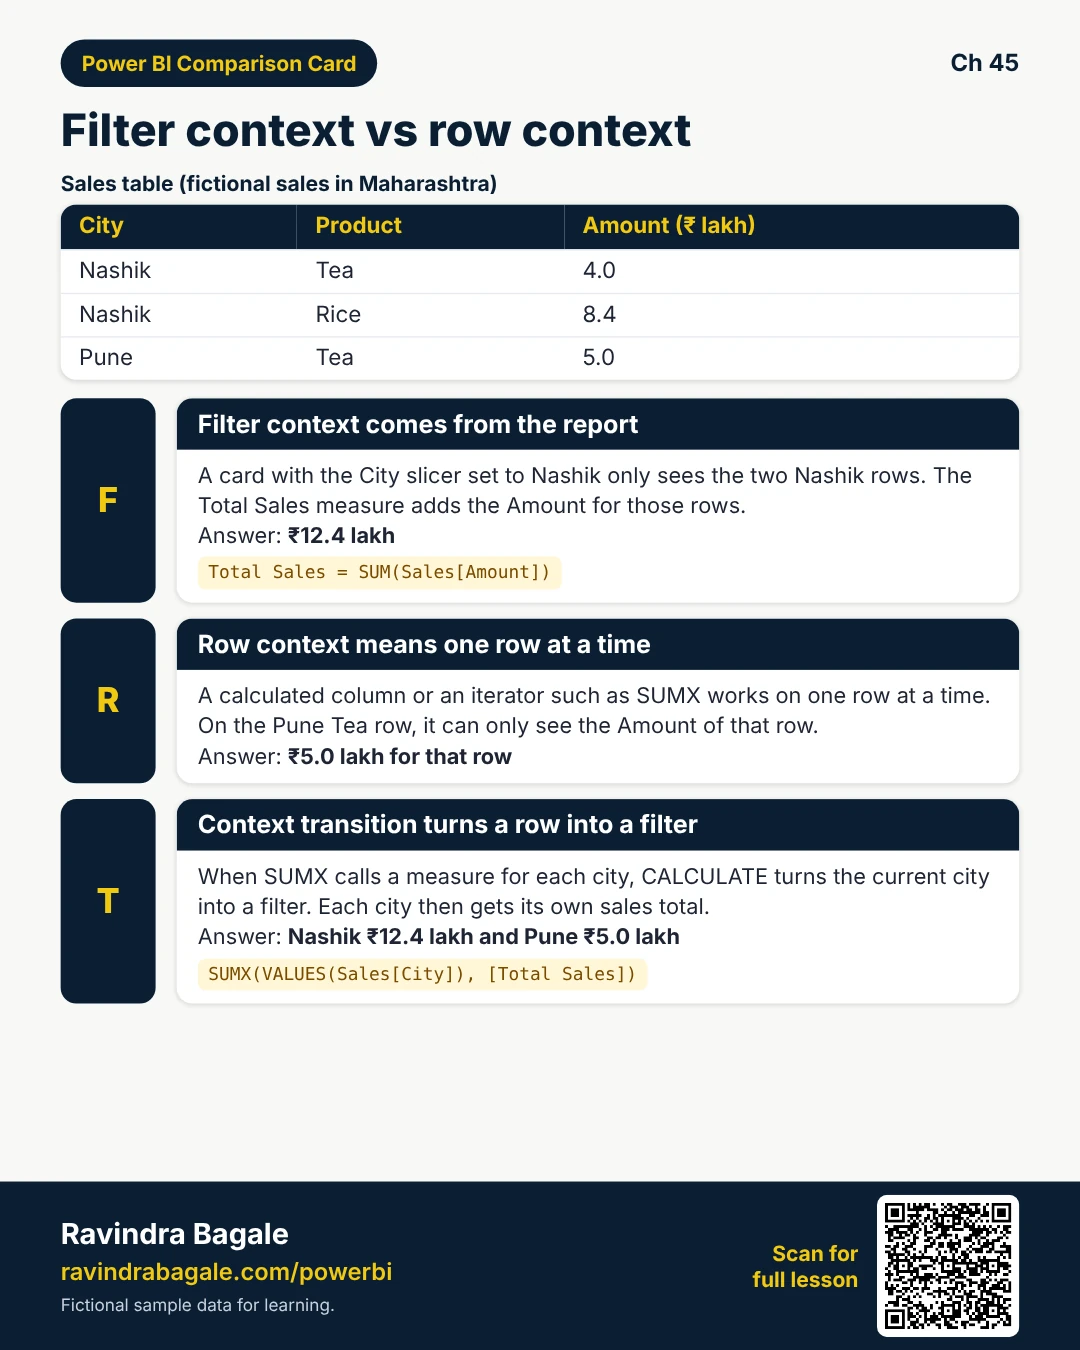
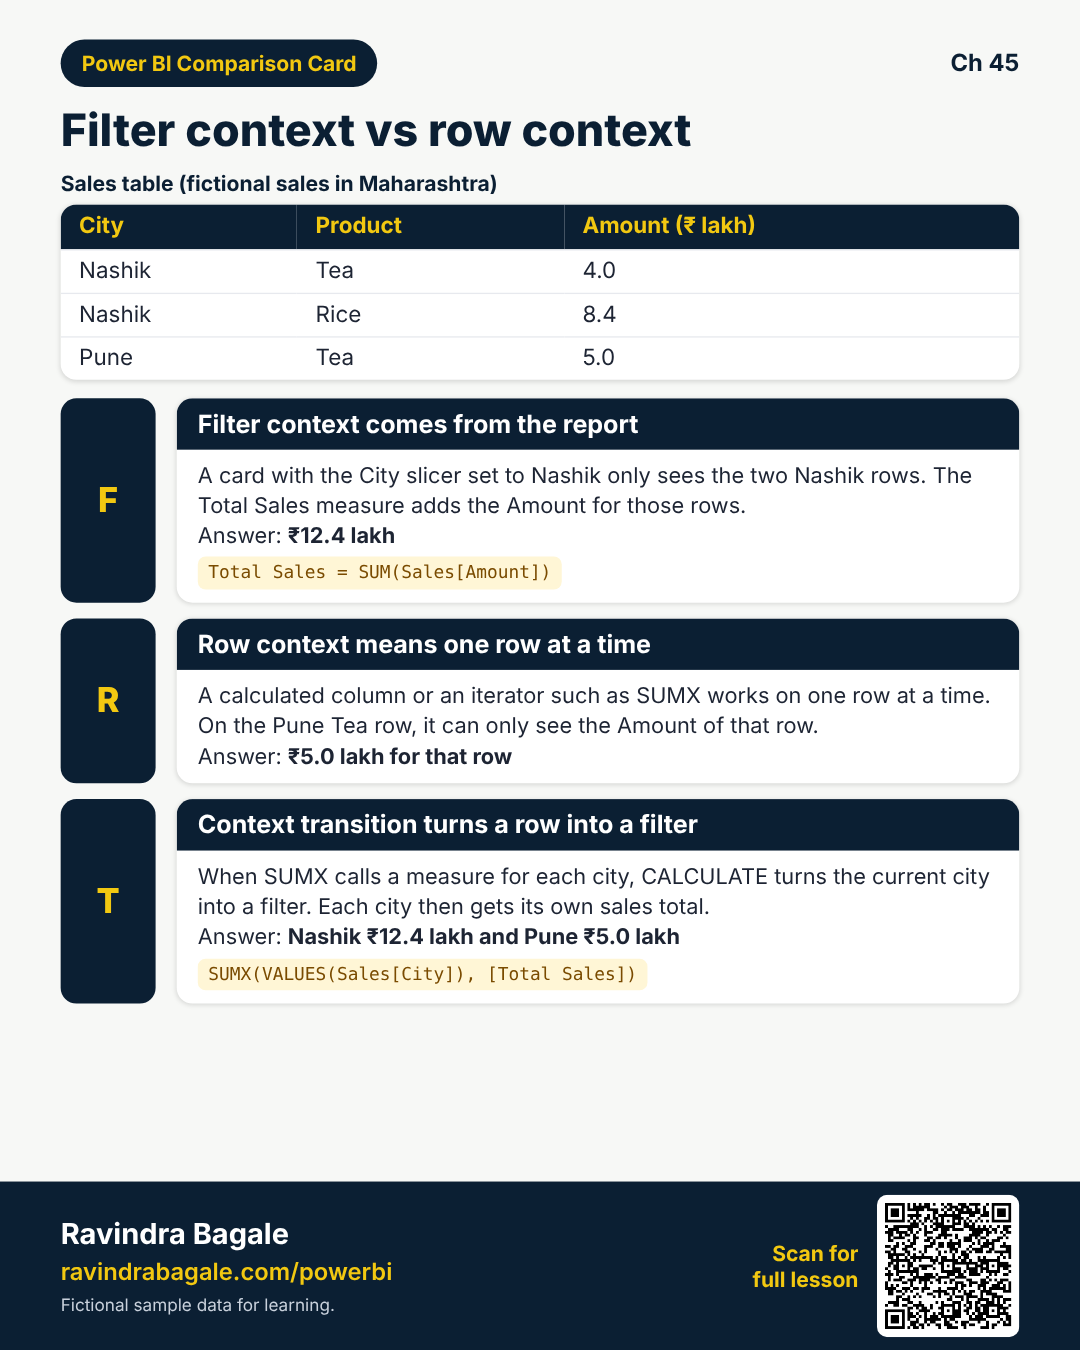
What: Filter context comes from visuals, slicers, and CALCULATE. Row context exists when a formula iterates rows (calculated column, FILTER, SUMX).
How — name them out loud:
Vertical steps (one under another)
- Look at a card with City slicer = Nashik — that is filter context.
- Look at a calculated column on Sales — that is row context per row.
- Measures usually start with filter context from the visual.
- Iterators add row context on top.
- Write one sentence for each before coding.
Tiny example: Card shows INR 12.4L for Nashik because filter context keeps City = Nashik (fictional).
Ravindra Bagale's Tip
Friends, if you cannot say which context you are in, do not nest CALCULATE yet.
Ravindra Bagale's Tip – मराठी
मित्रांनो, कोणता context आहे हे सांगता येत नसेल तर CALCULATE nest करू नका.
Ravindra Bagale's Tip – हिंदी
दोस्तों, कौन सा context है न कह सकें तो CALCULATE nest न करें।
2. What CALCULATE actually does
Why: People say CALCULATE makes it a measure — incomplete.
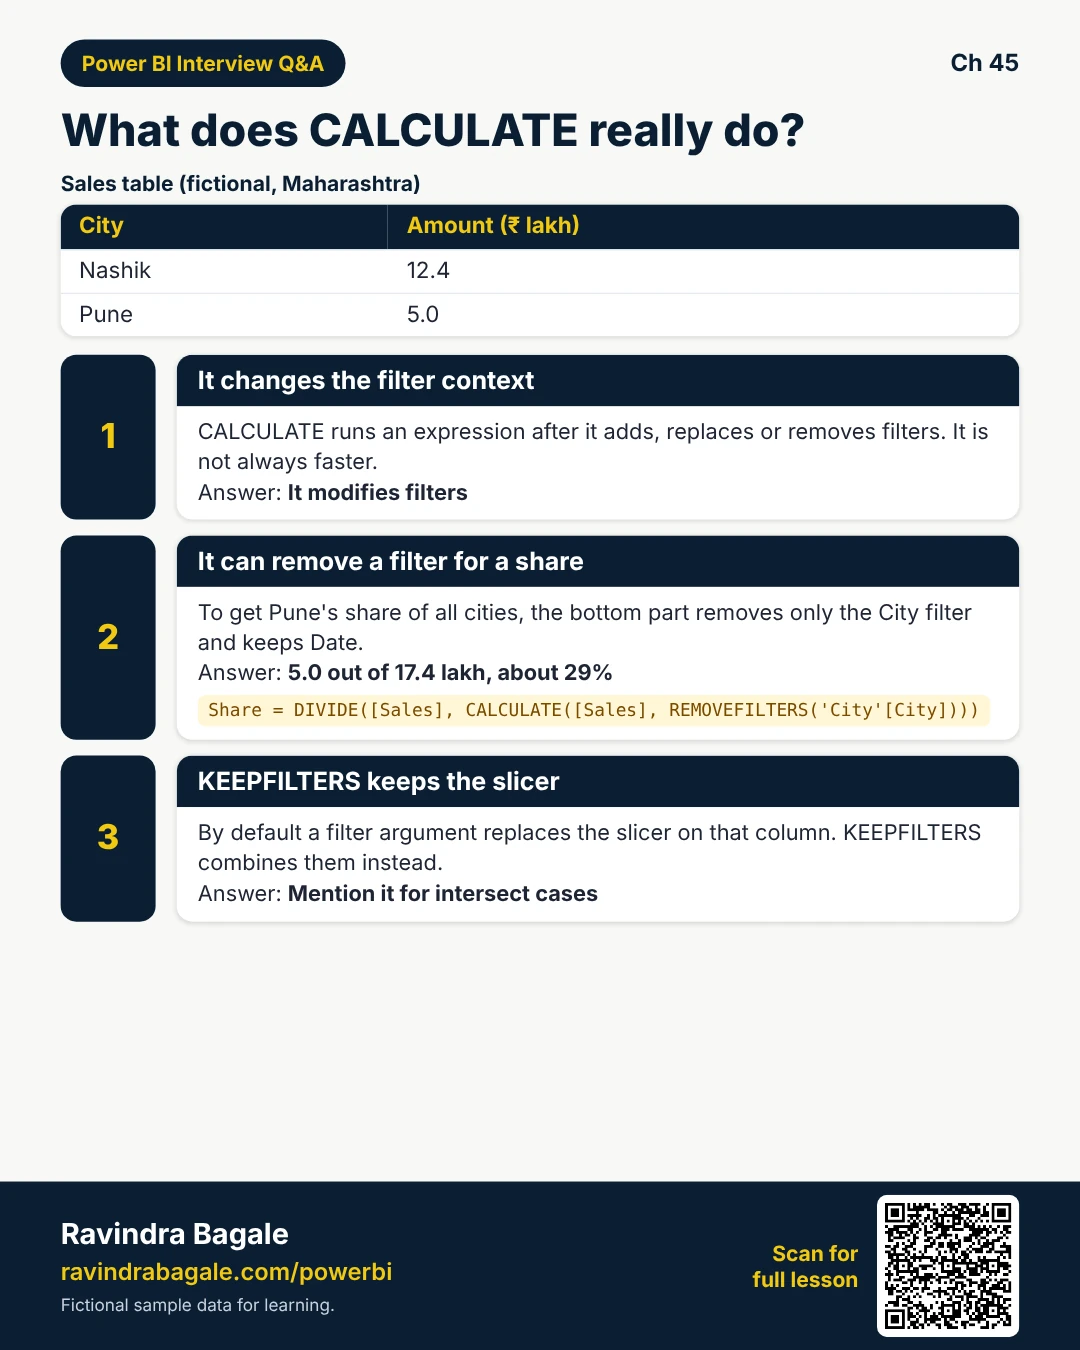
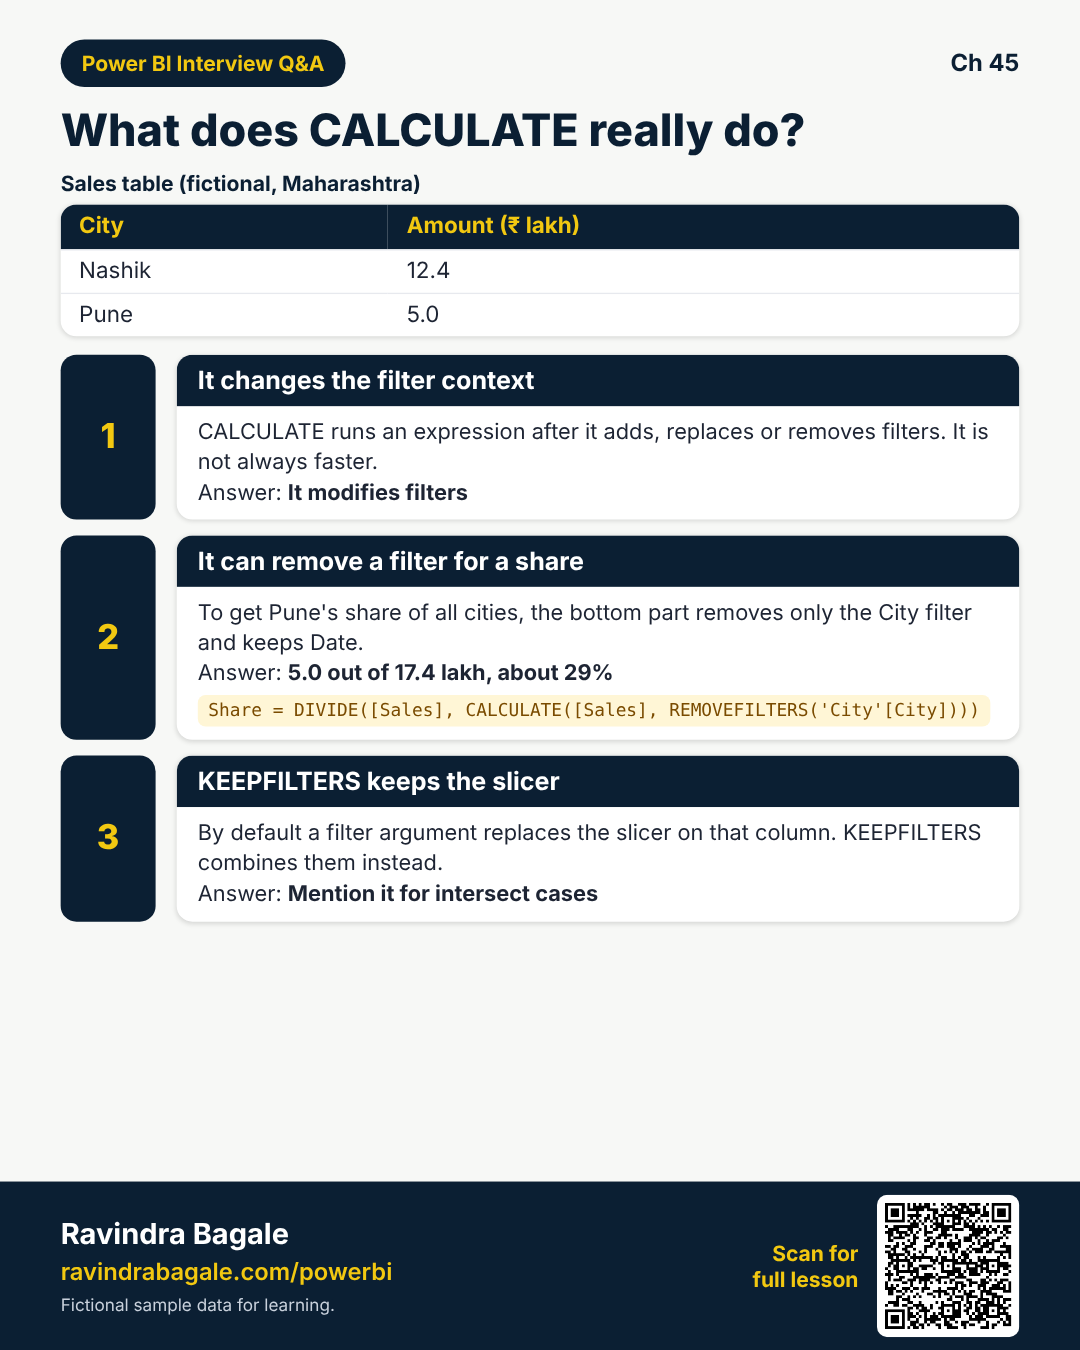
What: CALCULATE evaluates an expression under a modified filter context (and can force context transition).
How — modify on purpose:
Vertical steps (one under another)
- Start from the visual filters.
- Add/replace/remove filters in CALCULATE arguments.
- Evaluate the expression in that new filter context.
- Return the scalar result to the visual.
- Test with one city and one month only.
Tiny example: Sales LY = CALCULATE([Sales], SAMEPERIODLASTYEAR('Date'[Date])) keeps City slicer, shifts dates (concept).
Ravindra Bagale's Tip
Friends, CALCULATE is a filter wrench — not a performance fairy.
Ravindra Bagale's Tip – मराठी
मित्रांनो, CALCULATE filter चा रेंच आहे — performance परी नाही.
Ravindra Bagale's Tip – हिंदी
दोस्तों, CALCULATE filter की रेन्च है — performance परियाँ नहीं।
3. REMOVEFILTERS / ALL — clear with care
Why: ALL(everything) makes percent of total wrong or ignores the user slicer when you did not mean to.
What: REMOVEFILTERS (or ALL on a table/column) clears filters so you can compute a denominator or ignore a dimension.
How — clear only what you must:
Vertical steps (one under another)
- For percent of all cities: clear City filters in the denominator, keep Date.
- Prefer REMOVEFILTERS('City'[City]) over removing the whole model.
- Verify the slicer for Date still affects both parts.
- Name measures percent of Total City clearly.
- Compare card with and without City slicer.
Tiny example: Percent of MH = DIVIDE([Sales], CALCULATE([Sales], REMOVEFILTERS('City'[City]))) — Pune share of all cities (fictional).
Ravindra Bagale's Tip
Friends, clearing Date by accident is the classic YoY bug — be surgical.
Ravindra Bagale's Tip – मराठी
मित्रांनो, चुकून Date clear करणे क्लासिक YoY bug — शस्त्रक्रिया करा.
Ravindra Bagale's Tip – हिंदी
दोस्तों, गलती से Date clear करना क्लासिक YoY bug — सर्जरी करें।
4. KEEPFILTERS when overwrite hurts
Why: CALCULATE filter arguments replace filters on the same column by default — sometimes you wanted to intersect.
What: KEEPFILTERS keeps existing filters and intersects with the new predicate.
How — intersect instead of replace:
Vertical steps (one under another)
- Notice when a slicer is ignored after CALCULATE.
- Wrap the filter argument with KEEPFILTERS(...).
- Retest with two slicers on related columns.
- Document why KEEPFILTERS is there.
- Prefer clear model design over clever nesting.
Tiny example: Region = West with KEEPFILTERS still respects a City slicer inside West (concept).
Ravindra Bagale's Tip
Friends, if the slicer died, ask: replace vs intersect — KEEPFILTERS is often the fix.
Ravindra Bagale's Tip – मराठी
मित्रांनो, slicer मेला असेल तर विचारा: replace vs intersect — KEEPFILTERS अनेकदा उपाय.
Ravindra Bagale's Tip – हिंदी
दोस्तों, slicer मर गया हो तो पूछें: replace vs intersect — KEEPFILTERS अक्सर हल।
5. Context transition (simple picture)
Why: Inside SUMX, you are in row context; a naked measure may not see the row as a filter.
What: Context transition turns row context into filter context — CALCULATE triggers it when you call a measure inside an iterator.
How — see it once:
Vertical steps (one under another)
- Write a SUMX over cities of a sales measure.
- Notice CALCULATE/measure call applies each city as a filter.
- Avoid accidental transition that explodes cardinality.
- Prefer clear measures over hidden transitions in columns.
- Test on a tiny city table first.
Tiny example: SUMX(City, [Sales]) uses transition so each city filters Sales (mental model).
Ravindra Bagale's Tip
Friends, transition is powerful and expensive on big tables — know when it fires.
Ravindra Bagale's Tip – मराठी
मित्रांनो, transition शक्तिशाली आणि मोठ्या टेबलवर महाग — कधी पेटते ते जाणा.
Ravindra Bagale's Tip – हिंदी
दोस्तों, transition शक्तिशाली और बड़ी टेबल पर महंगा — कब जलता है जानें।
6. Interview myths to kill
Why: Myths waste interview minutes.
What: CALCULATE is not always faster, not only for time intel, and not a substitute for a proper Date table.
How — answer cleanly:
Vertical steps (one under another)
- Say: modifies filter context.
- Give one REMOVEFILTERS denominator example.
- Mention KEEPFILTERS for intersect.
- Admit when you escalate complex transition bugs.
- Refuse ALL(everything) as a default habit.
Tiny example: Strong line: I clear only the columns I must; I keep user slicers unless the measure says otherwise.
Ravindra Bagale's Tip
Friends, draw filter context with boxes on paper in interviews — it looks senior.
Ravindra Bagale's Tip – मराठी
मित्रांनो, interview मध्ये filter context पेपरवर काढा — senior दिसते.
Ravindra Bagale's Tip – हिंदी
दोस्तों, interview में filter context कागज़ पर बनाएं — senior लगता है।
Quiz (5 questions)
1. Filter context mainly comes from:
2. CALCULATE's job is to:
3. REMOVEFILTERS on City in a denominator often helps:
4. KEEPFILTERS is useful when:
5. Context transition happens when:
Practice tasks (12) — hints only, no full answers
- Task. Define filter context vs row context in two lines.
Hint: section 1. - Task. Rewrite a wrong CALCULATE makes measures interview myth.
Hint: section 2. - Task. Write a percent of all cities measure idea with REMOVEFILTERS.
Hint: section 3. - Task. When would ALL('Date') break a YoY card?
Hint: clears dates. - Task. Explain KEEPFILTERS with a Region + City slicer story.
Hint: section 4. - Task. Tiny example: why SUMX(City,[Sales]) needs transition thinking.
Hint: section 5. - Task. List three CALCULATE interview myths to avoid.
Hint: section 6. - Task. Nashik INR 12.4L card — which context?
Hint: filter. - Task. Surgical clear: City only vs whole model — which and why?
Hint: section 3. - Task. Draw boxes: visual filters to CALCULATE to result.
Hint: paper. - Task. Name one performance risk of heavy transition on big tables.
Hint: section 5 tip. - Task. Fix Kabir ALL everything YoY — what do you clear instead?
Hint: story.
Ravi Sir's cards (Excel card style)
Standalone cards — no tip or photo sections. QR points to this lesson. Download PNG to revise offline.
Think like a professional
In a real tenant, rights and sharing are controlled by Fabric / Power BI admins. Always follow your company policy. This lesson uses fictional people and numbers so you can practise the ideas safely.