38.1 Reports vs Dashboards, Sharing and Apps
Chala mitrano — today we stop calling every screen a dashboard. We pin, share, and publish Apps the way a real team does.
चला मित्रांनो — आज प्रत्येक screen ला dashboard म्हणणे थांबवतो. Pin, share आणि App publish करतो जसे खऱ्या टीममध्ये होते.
चला मित्रों — आज हर screen को dashboard कहना बंद करते हैं। Pin, share और App publish करते हैं जैसे असली टीम में होता है।
- Explain report vs dashboard in the Power BI Service.
- Pin a tile and describe when a data alert helps.
- Choose Share, workspace role, or App for a real case.
- Outline how to create and update an App with audiences.
- Refuse Publish to web for private company data.
Start with a problem (fictional). Neha Kulkarni (Pune) built a solid Blinkit-style MH sales report. She Shared the link with 12 people on WhatsApp. By Friday, three links were old, two managers still opened Desktop .pbix copies, and the CFO asked for one morning dashboard with an alert if Nashik orders fall. Neha needs App + dashboard discipline — not more links.
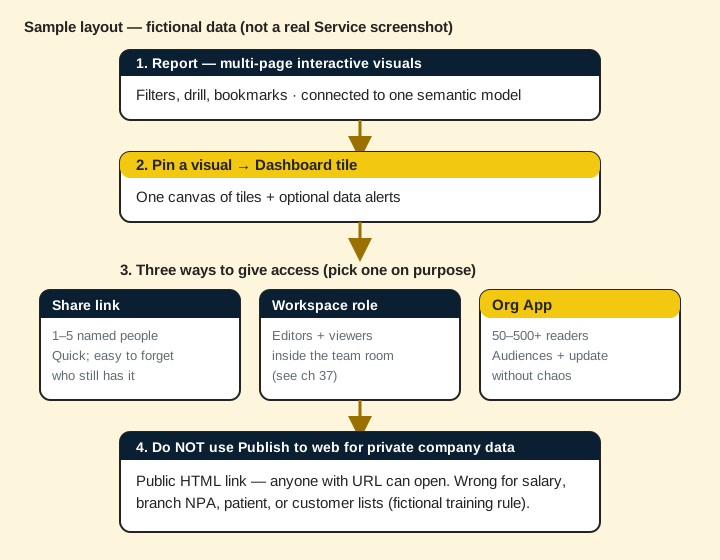
1. Report vs dashboard (Service meaning)
Why: Students mix the two words. In the Service they are different tools.
What: A report is multi-page interactive visuals on one semantic model. A dashboard is a single canvas of pinned tiles (often from many reports) plus optional alerts.
How — keep them straight:
Vertical steps (one under another)
- Open a report — many pages, slicers, drill-through.
- Pin a visual — it becomes a tile on a dashboard.
- Dashboards do not replace reports for deep analysis — they are the morning glance.
Tiny example: Neha Kulkarni in Pune pins GMV ₹18.6L (fictional) and Orders 1,240 to dashboard MH Morning. She still opens the full report when a city looks wrong.
Ravindra Bagale's Tip
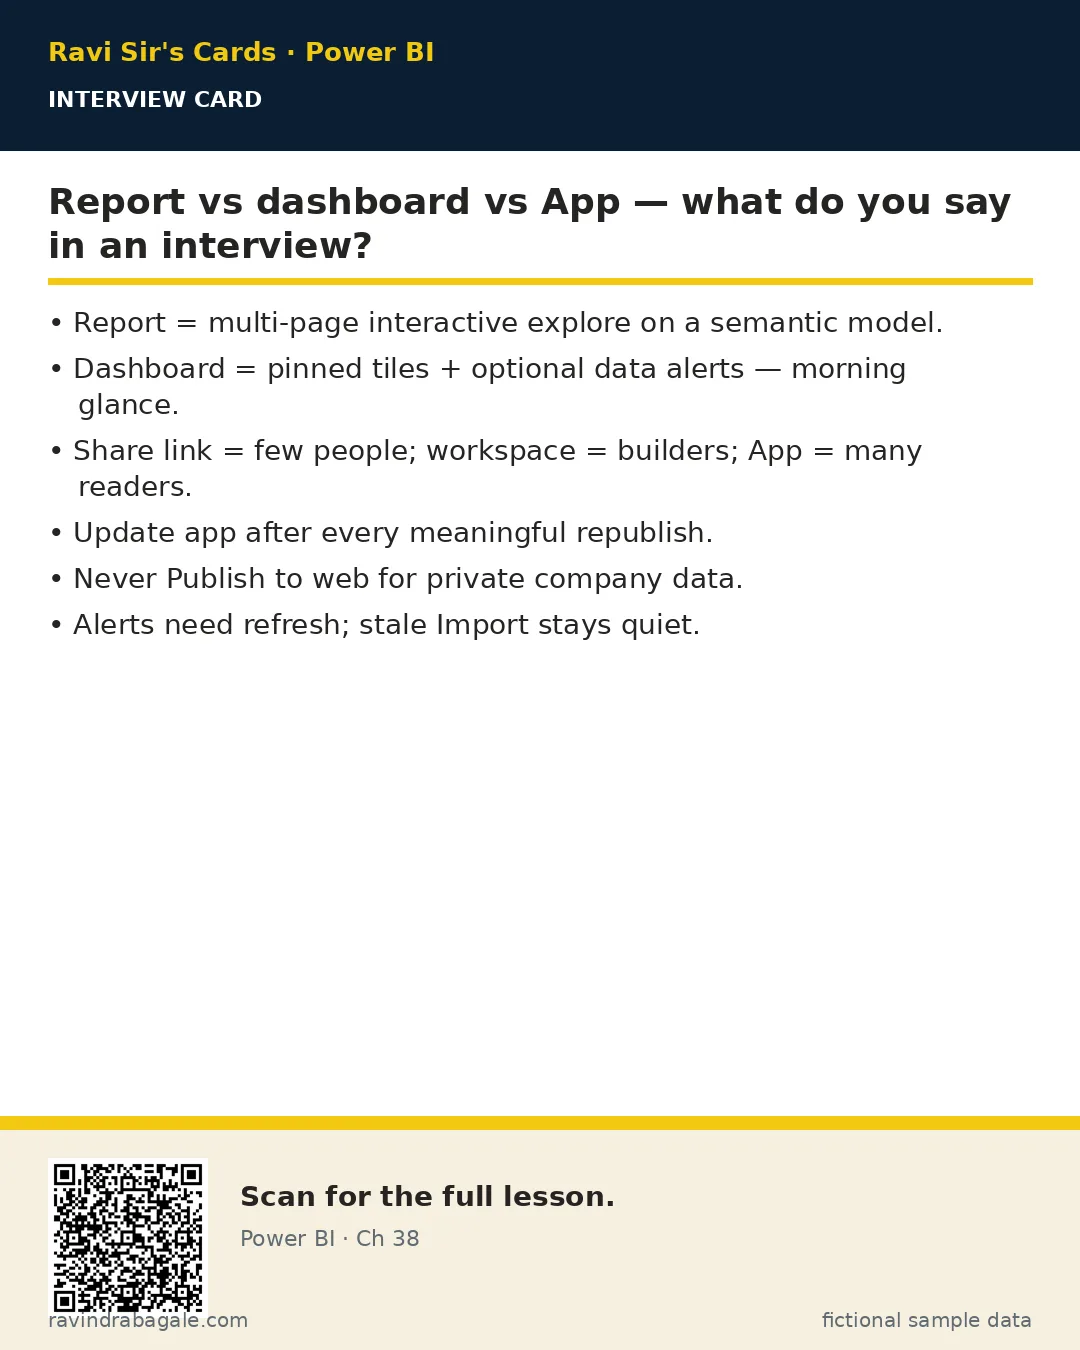
Friends, in interviews say: report = explore; dashboard = glance + alert. Don't say they are the same.
Ravindra Bagale's Tip – मराठी
मित्रांनो, interview मध्ये सांगा: report = explore; dashboard = glance + alert. दोन्ही एकच आहेत असे म्हणू नका.
Ravindra Bagale's Tip – हिंदी
दोस्तों, interview में कहें: report = explore; dashboard = glance + alert। दोनों एक ही हैं ऐसा न कहें।
2. Pinning tiles and alerts on dashboard tiles
Why: Managers want a beep when a KPI crosses a line — without opening Desktop.
What: You pin a tile, then set a data alert on card/KPI/gauge tiles (Import models).
How — set an alert (concept):
Vertical steps (one under another)
- Open the report visual — Pin visual — choose or create a dashboard.
- On the dashboard tile — ellipsis — Manage alerts.
- Set a threshold, e.g. Orders below 300 (fictional) — email Neha.
- Remember: alerts need refresh; stale Import = silent tile.
Tiny example: When Nashik fictional orders drop under 300, Neha gets mail at about 07:15 IST after refresh — she calls Raja Patil before standup.
Ravindra Bagale's Tip
Friends, alerts are not magic SMS for every DirectQuery case — check what your tenant allows. Prefer Import for simple threshold alerts in training.
Ravindra Bagale's Tip – मराठी
मित्रांनो, alerts प्रत्येक DirectQuery साठी जादू नाहीत — tenant काय देते ते पाहा. Training मध्ये साध्या threshold साठी Import सोयीस्कर.
Ravindra Bagale's Tip – हिंदी
दोस्तों, alerts हर DirectQuery पर जादू नहीं — tenant क्या देता है देखें। Training में सादे threshold के लिए Import आसान है।
3. Share link vs workspace access vs App
Why: Five friends and five hundred readers need different doors.
What: Three doors: Share on a report/dashboard, Access on the workspace, or an organisational App.
How — choose in 20 seconds:
Vertical steps (one under another)
- Only a few named reviewers? — Share (or temporary Viewer).
- Team that builds and tests? — workspace roles (ch 37).
- Whole org / many city managers? — App with audiences.
Tiny example: Carlos Mendes in Lisbon (fictional EU ops) gets a Share link for one week. 40 MH city managers get the App — not 40 Share links.
Ravindra Bagale's Tip
Friends, Apps scale. Share links litter. If you cannot list who still has access, you already lost governance.
Ravindra Bagale's Tip – मराठी
मित्रांनो, Apps scale होतात. Share links गोंधळ करतात. कोणाकडे access आहे याची यादी नाही तर governance हरवली.
Ravindra Bagale's Tip – हिंदी
दोस्तों, Apps scale होते हैं। Share links बिखराव करते हैं। किसके पास access है सूची नहीं तो governance खो गई।
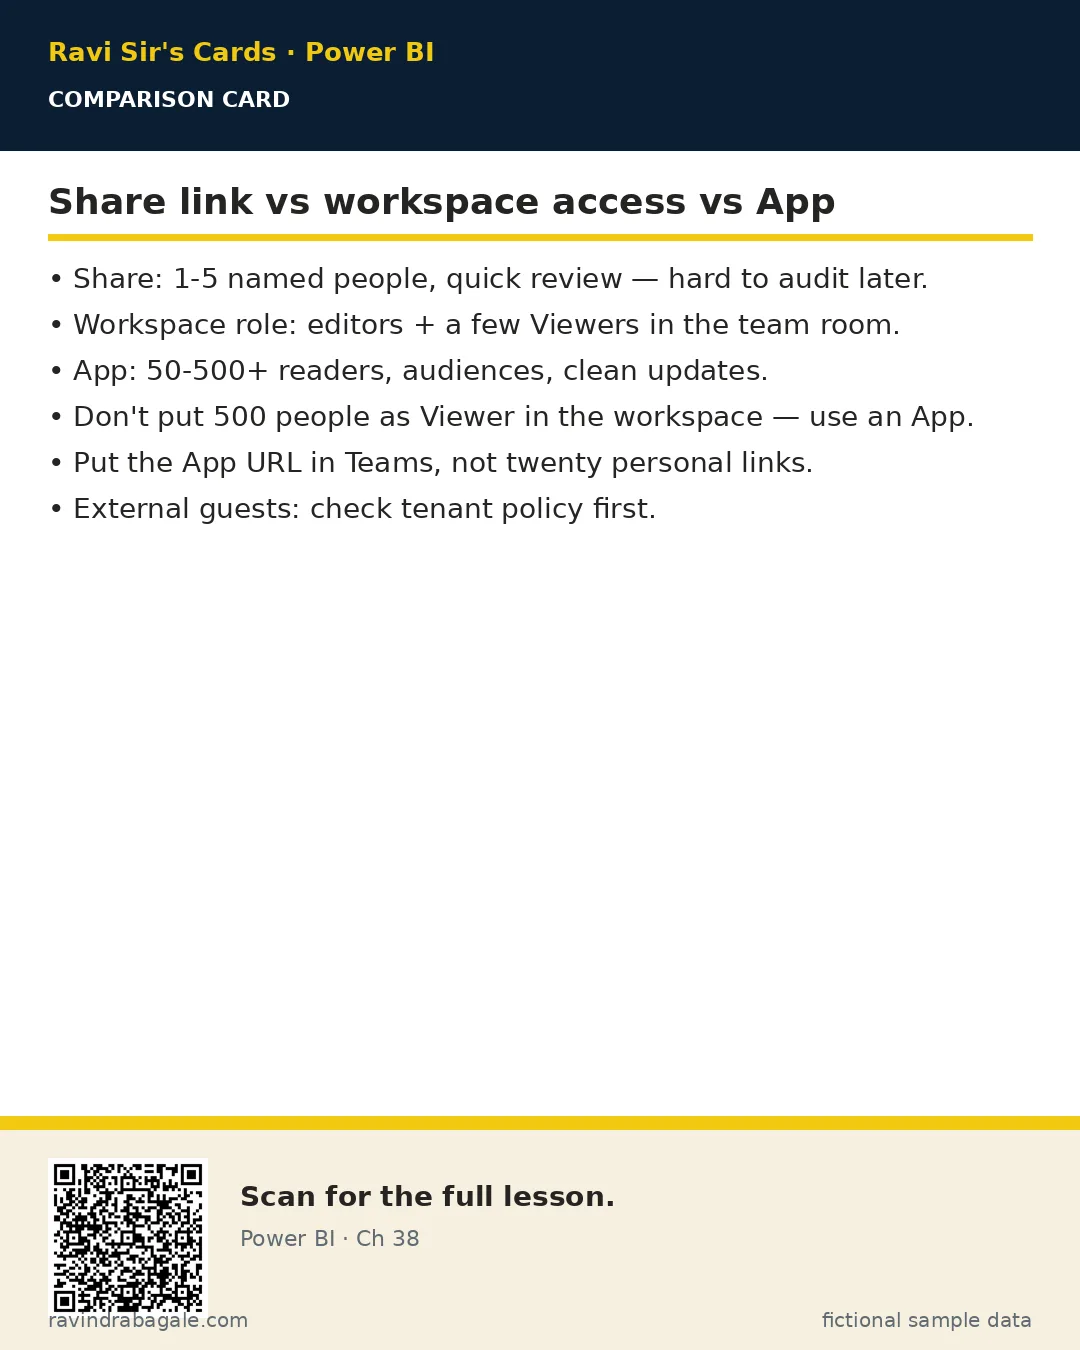
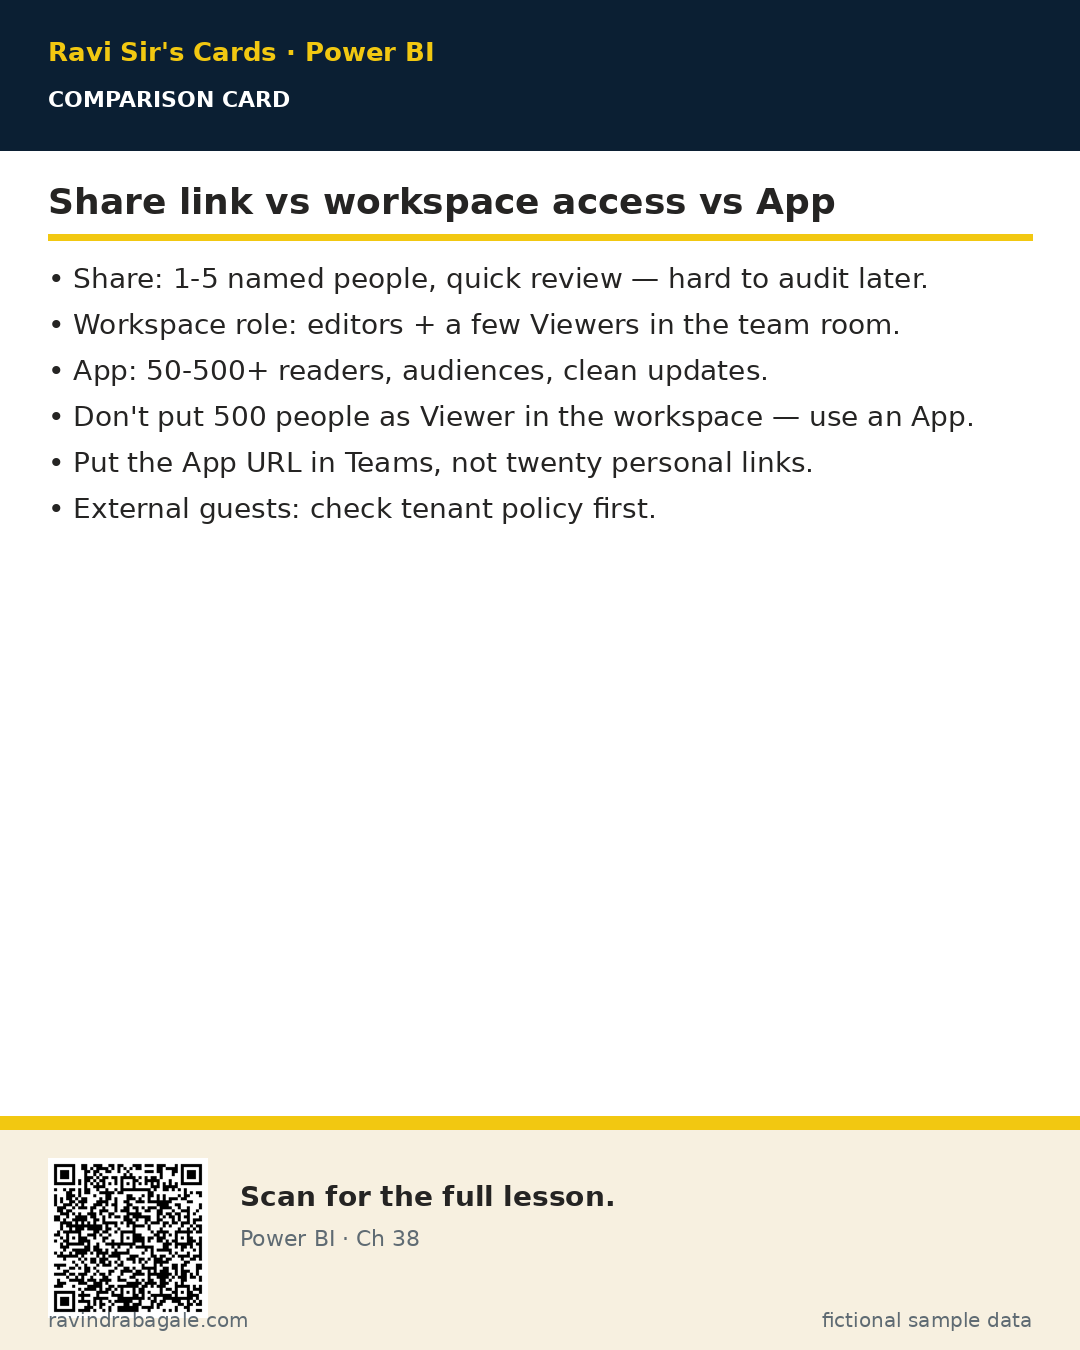
| Way | Best for | Watch out |
|---|---|---|
| Share link | 1-5 named people, quick review | Hard to audit months later |
| Workspace role | Builders + a few Viewers | Don't dump 500 people as Viewer here — use App |
| App | 50-500+ readers, clean update | Needs Member/Admin to publish; audiences help |
About this data: This table uses columns: Way, Best for, Watch out. This table uses columns: City, Orders, GMV INR. This table uses columns: Wrong, Better. Values shown are the lesson examples already on this page (not a new dataset).
4. Building and updating an App with audiences
Why: One publish should update everyone without emailing a new link each Monday.
What: An App packages selected workspace content. Audiences can show different navigation to different groups.
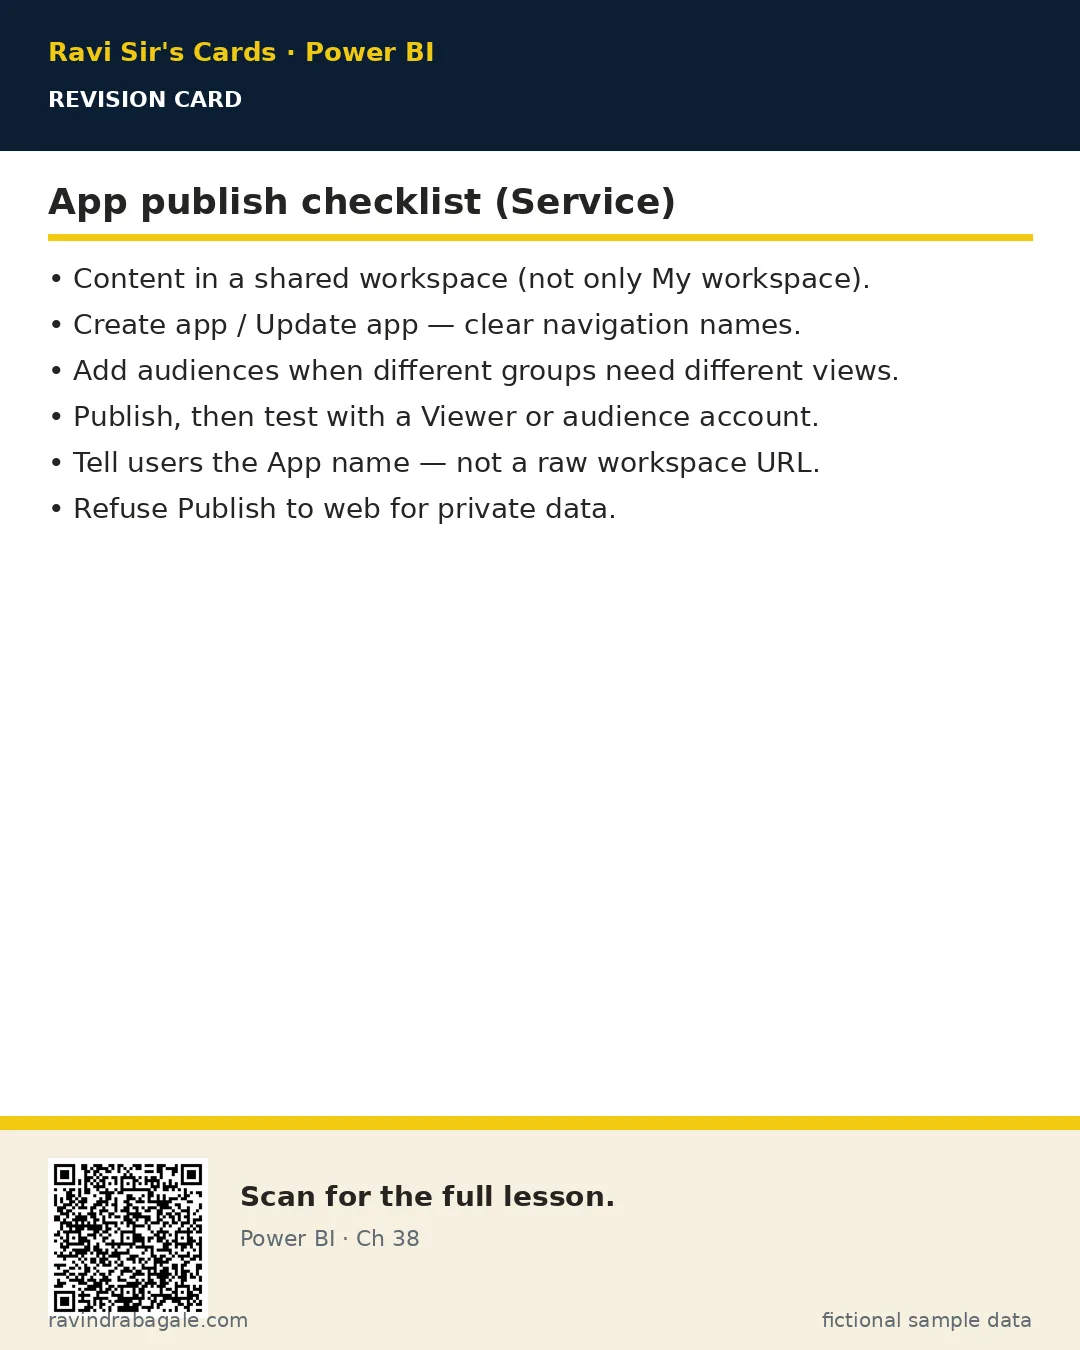
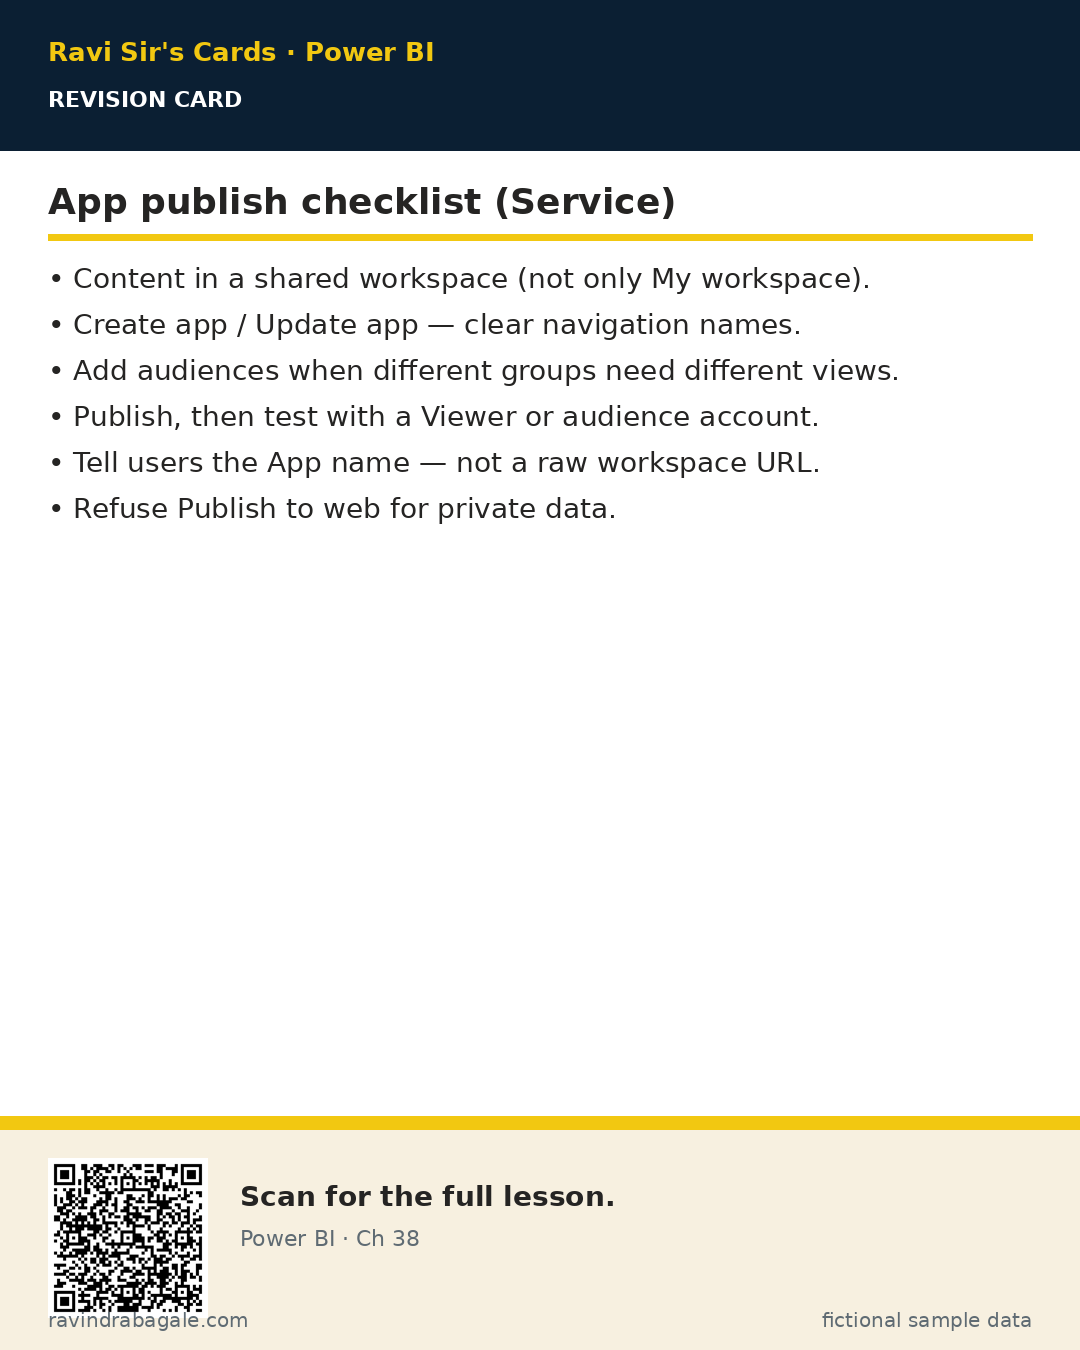
How — publish an App (concept steps):
Vertical steps (one under another)
- In the workspace — Create app (or Update app).
- Include the report (and dashboard if needed); set navigation names clearly.
- Add audience
MH City Managersand audienceFinance Readif views differ. - Publish / Update. Tell users the App name — not a raw workspace URL.
- Next week: change report — Update app so everyone sees the new version.
Tiny example: Priya updates App Sales MH Live after fixing a typo. Raja opens the same App icon — no new email attachment.
Ravindra Bagale's Tip
Friends, put the App URL in Teams, not twenty personal Share links. Update app is your Monday habit.
Ravindra Bagale's Tip – मराठी
मित्रांनो, App URL Teams मध्ये ठेवा, वीस Share links नाही. Update app हा सोमवारचा सवय असू द्या.
Ravindra Bagale's Tip – हिंदी
दोस्तों, App URL Teams में रखें, बीस Share links नहीं। Update app सोमवार की आदत बनाएं।
5. Org sharing rules and free-user viewers on capacity
Why: Licence and tenant settings decide who can open shared content.
What: Pro/PPU/capacity rules vary. Free users may view content on Premium/Fabric capacity when admins allow. Always check your org policy — this page teaches the idea, not your contract.
How — ask before you promise:
Vertical steps (one under another)
- Confirm whether viewers need Pro or can use free + capacity.
- Check external guest sharing is allowed before inviting a vendor.
- Document the answer in your runbook (one line is enough).
Tiny example: Fictional training org: city managers on free + capacity; builders on Pro. Interview answer: It depends on capacity and tenant settings.
6. When not to use Publish to web
Why: Publish to web creates a public HTML link. Anyone with the URL can open it — no company login.
What: It is for public data only (marketing demos, open stats). Never for salaries, patients, NPA, or customer lists.
How — refuse safely:
Vertical steps (one under another)
- If a manager asks for just a public link, explain the risk in one sentence.
- Offer App, Share, or secure embed instead.
- Admins can disable Publish to web tenant-wide — good practice.
Tiny example: Sofia Müller (Munich, fictional) rejects Publish to web for euro demand plans. She publishes an App to the EU-IN workspace audience instead.
Ravindra Bagale's Tip
Friends, if data would hurt someone when leaked, Publish to web is wrong. Full stop.
Ravindra Bagale's Tip – मराठी
मित्रांनो, data लीक झाले तर कोणाला त्रास होईल तर Publish to web चुकीचे. पूर्ण विराम.
Ravindra Bagale's Tip – हिंदी
दोस्तों, data लीक होने पर किसी को नुकसान हो तो Publish to web गलत। पूरा विराम।
7. Worked example — three industries
All numbers are fictional sample data.
Quick commerce (Maharashtra)
Why: 40 city managers need one App, not 40 Share links.
- Publish report to Sales MH.
- Pin GMV and Orders to dashboard MH Morning.
- Create App Sales MH Live with audience MH City Managers.
- Alert: Orders below 300 emails Neha.
| City | Orders | GMV INR |
|---|---|---|
| Pune | 1,240 | 18,60,000 |
| Nashik | 410 | 3,40,000 |
| Kolhapur | 280 | 2,10,000 |
Hospital network (fictional care group)
Dr. Amina Yusuf in Nairobi only needs bed occupancy glance on a dashboard tile. Clinical detail stays in a report App for ward leads — never Publish to web.
SaaS billing (Singapore)
Mei Lin pins MRR S$2.4M (fictional) to an exec dashboard; CSMs use the App for cohort pages.
Recap. Report explores. Dashboard glances and alerts. Share for few, workspace for builders, App for many. Never Publish to web private data.
Common mistakes
| Wrong | Better |
|---|---|
| Calling every canvas a dashboard | Use Service words: report vs dashboard |
| 500 Viewers in the workspace | App + audiences |
| Publish to web for HR data | App / Share / secure embed |
| Never updating the App after republish | Update app every release |
Quiz (5 questions)
1. In the Power BI Service, a dashboard is best described as:
2. You need 200 city managers to see the same live report. Best approach?
3. Publish to web is safe for:
4. After you change a report used by an App, you should:
5. Data alerts on tiles typically need:
Practice tasks (12) — hints only, no full answers
- Task. Write one sentence distinguishing report vs dashboard in the Service.
Hint: explore vs glance. - Task. List three tiles you would pin for a Mumbai hotel occupancy morning view (fictional).
Hint: occupancy %, ADR, RevPAR style KPIs. - Task. When would you use Share instead of an App?
Hint: few named people, short review. - Task. Name two audiences for an App covering MH sales and Finance.
Hint: section 4. - Task. Explain why Publish to web is wrong for patient bed lists.
Hint: public URL. - Task. Draft the alert threshold text for Nashik orders (fictional).
Hint: below 300 example. - Task. Interview 45s: how do you share with 500 readers?
Hint: App + capacity/licence note. - Task. What happens if you republish a report but never Update app?
Hint: readers may stay on old package. - Task. Compare workspace Viewer vs App audience in a two-column table of your own.
Hint: builders room vs readers storefront. - Task. Find three risks of WhatsApp-sharing report URLs.
Hint: stale links, no audit, wrong version. - Task. Mei Lin in Singapore needs MRR glance + alert. Report or dashboard first?
Hint: pin to dashboard. - Task. Write the one-line refusal when asked for Publish to web on HR data.
Hint: section 6.
Ravi Sir's cards (Excel card style)
Standalone cards — no tip or photo sections. QR points to this lesson. Download PNG to revise offline.
Think like a professional
In a real tenant, rights and sharing are controlled by Fabric / Power BI admins. Always follow your company policy. This lesson uses fictional people and numbers so you can practise the ideas safely.